 News & Updates
 Photo Gallery
 Seminars
Topic of Interest
Functionality Based Building Taxonomy
by: Karim Farokhnia, Giuseppe Lomiento, Andre Barbosa, Mikhail Gershfeld, John van de Lindt
The evaluation of the building taxonomies available in the literature resulted in the adoption of the Global Earthquake Model Building Taxonomy (GEM-BT) as the COE's reference building taxonomy during 2017 first semi-annual meeting. GEM-BT is considered the state-of-the-art building structural taxonomy for risk and resilience assessment of communities when exposed to seismic hazards. Since then, the COE taxonomy team has been expanding it to create a building functionality taxonomy that can be used effectively for community resiliency modeling and to address the natural multi-hazard environments studied within the COE. From the team's survey, there appears to be no written literature on this type of building taxonomy. This taxonomy is intended for categorizing physical (structural and non-structural), social and economic (building specific) attributes of a building inventory (individual buildings or portfolio of buildings) at the community resiliency level (functionality recovery) and helping to identify the needs for the development of building damage and functionality fragility functions.
The GEM-BT taxonomic groups dealing with structural building components have been expanded to ensure that relevant information is provided to damage and functionality fragility functions associated with seismic, tornado, hurricane, and tsunami hazards. Nonstructural attributes that contribute significantly to hazard-induced casualties, loss of use or downtime, monetized losses, as well as repair-cost and repair-time, are being included. For example, the properties of the building envelope and load path continuity of the vertical system is critical to wind-related hazards (hurricane, tornado), the building shape and elevation of building equipment above grade is critical to water-related hazards (flood, tsunami). The building replacement value and speed of replacement (insurance and resource availability) are critical to recovery time and cost.
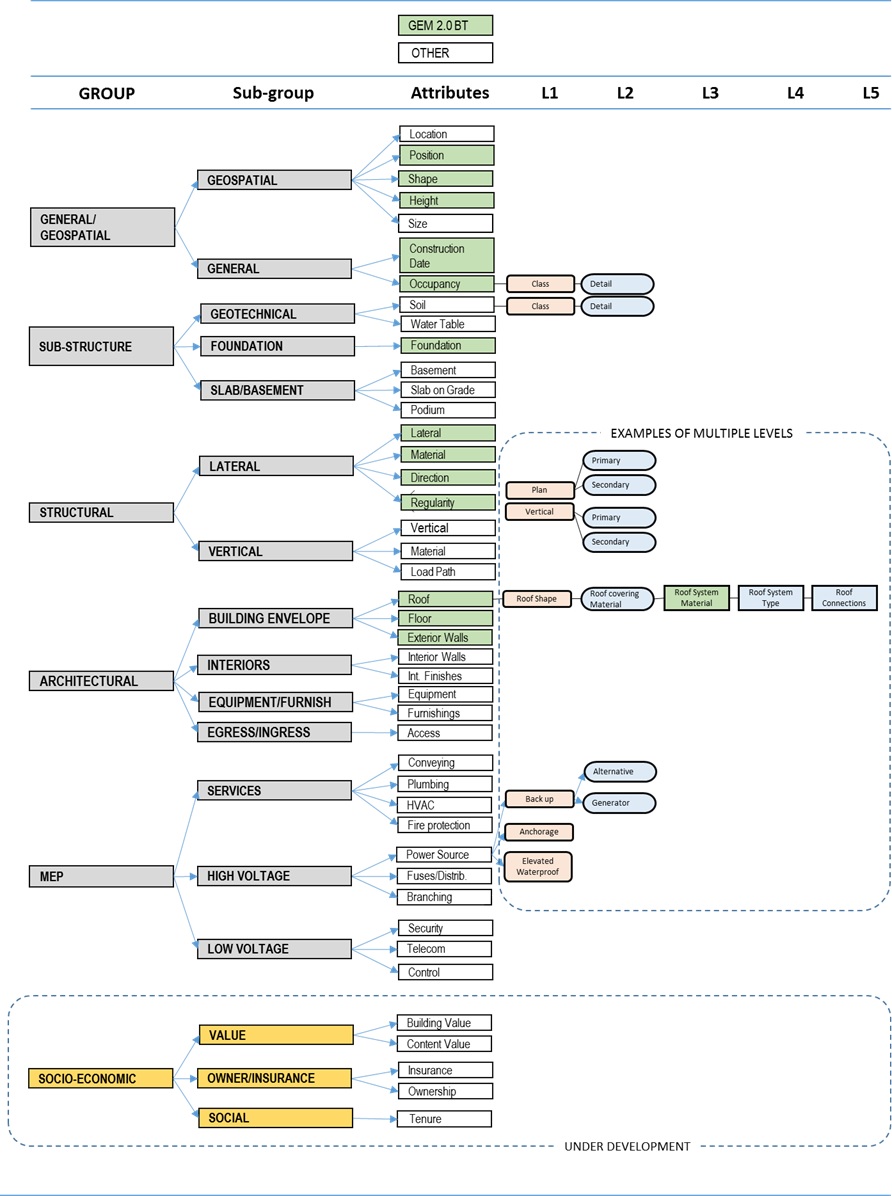
The building functionality taxonomy is organized into six major groups of attributes. Each of the groups and attributes are sub-divided into various additional attributes characterizing different levels of detail addressing different aspects of a building. The six groups are:
Group 1: General/Geospatial, provides information about location, height, date of construction, occupancy, building position, and shape in plan.
Group 2: Geotechnical systems, focuses on soil classification, foundation systems, and sub-structure systems below and above ground.
Group 3: Structural systems, addresses materials and types of vertical and lateral load resisting system, and structural irregularities in different directions.
Group 4: Architectural systems, targets the building envelope systems, interiors, equipment & furnishing, ingress/egress systems.
Group 5: MEP systems, provides information about mechanical, electrical and plumbing systems.
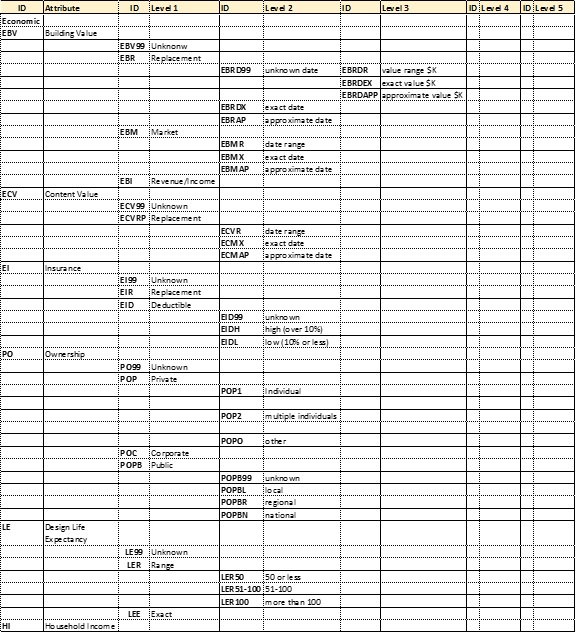
Group 6: Socio-economic attributes, describes accessibility of the building and tenure of inhabitants, and provides information about ownership type, design life expectancy, monetary value, insurance type and deductible level, and property income generation ability. (Still in development).
Each attribute currently has up to five levels of detail, where each attribute is identified with a string code and is envisioned as part of building taxonomy string for either direct input into IN-CORE or collected through an IN-CORE handheld or desktop user interface. For further details about the groups, read more here. Furthermore, for an example of the identification of the economic coding string, see the illustration here.
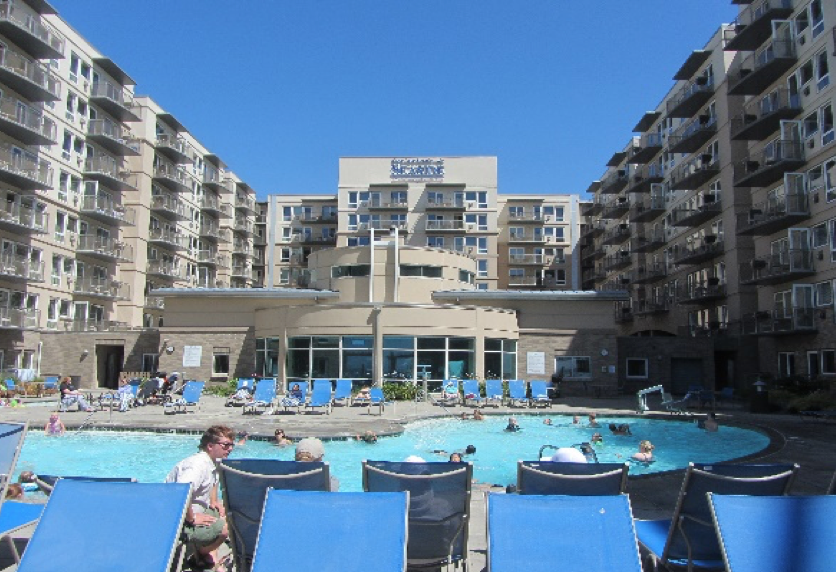
The application of the proposed functionality-based taxonomy to case-study buildings is currently underway and is intended to help finalize social and economic attributes for real applications, and validate the building attribute acquisition and categorization process. Examples of two buildings selected are a hospital in Joplin that was exposed to tornado hazards and a building in Seaside, Oregon, which has a high exposure to seismic and tsunami hazards. Illustrated next in this newsletter is the WorldMark Wyndham Resort located in Seaside, OR, which is used as an application example of the taxonomy being applied to a building with exposure to multiple hazards.
|
The case study building is the WorldMark Wyndham Resort located in Seaside, OR. The building is U shape with 33 meters height and was built in 2001. It has a mat foundation with one level basement. The structure of the building is a reinforced concrete frame with the main lateral force resisting systems consisting of shear walls and no irregularity due to the presence of well distributed seismic joints. The roof of the building is flat, and the floors are reinforced concrete slabs. The exterior walls are made of E.I.F.S with brick veneer on some floors, and interiors partitions are metal studs with gypsum wallboard. The building has a backup generator. |
|
Taxonomy code string (building info, geospatial, structural, architectural groups):
DX/CR+CIP/LPB+DUC/DY/CR+CIP/LPB+DUC/HEX:8+HBEX:1/YAPP:2001/RES+RES2F/BP1/
PLFU/IRRE/EWSL/RSH1+RMN+RC+RC1+RWCP/FC+FC1/FOSN/EBV99/EIV99/ECV99/EI99/
POPB99/
Social and economic is still not finalized and is manually added. |
|
The drawings for the buildings were available and building physical data was collected. The socio-economic data has not been developed and is not yet included in the taxonomy string. The taxonomy format, however, has been established and follows GEM-BT format [1]. The format is extendible both vertically (groups or attributes could be added) or horizontally (additional levels of detail could be added) wherever might be needed in the future.
AcknowledgmentWe would like to thank the social team for their engagement in development of the social attributes. We also thank the City of Seaside Public Works for providing access to the public records for the building case studies.
References-
S., Brzev, C., Scawthorn, A.W., Charleson, K.Jaiswal, “Interim Overview of GEM Building Taxonomy V2.0”, Global Earthquake Model, 2012.

Integration of Physical and Social Infrastructure Systems in Community Resilience, December 2017 Topic of the Month
Longitudinal Field Study in Lumberton, North Carolina
by: Elaina J. Sutley, Maria Dillard, Maria Watson, Donghwan Gu, Shane Crawford
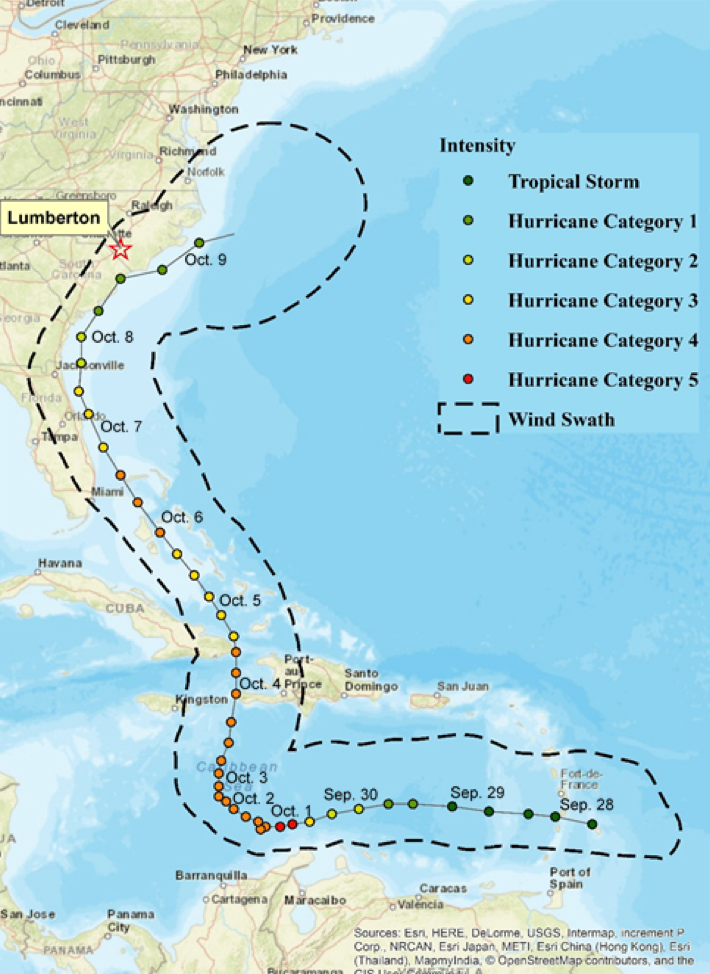
More than a week after the storm turned out to sea, parts of North Carolina had yet to experience flood crests, with many communities experiencing flood levels at or higher than Hurricane Floyd in 1999. The Lumber River reached flood stage in Lumberton, North Carolina on October 3rd due to local heavy rains. On October 11th, the Lumber River crested at almost 22 feet above the gage datum. The water level slowly fell, dropping below flood level on October 23rd.
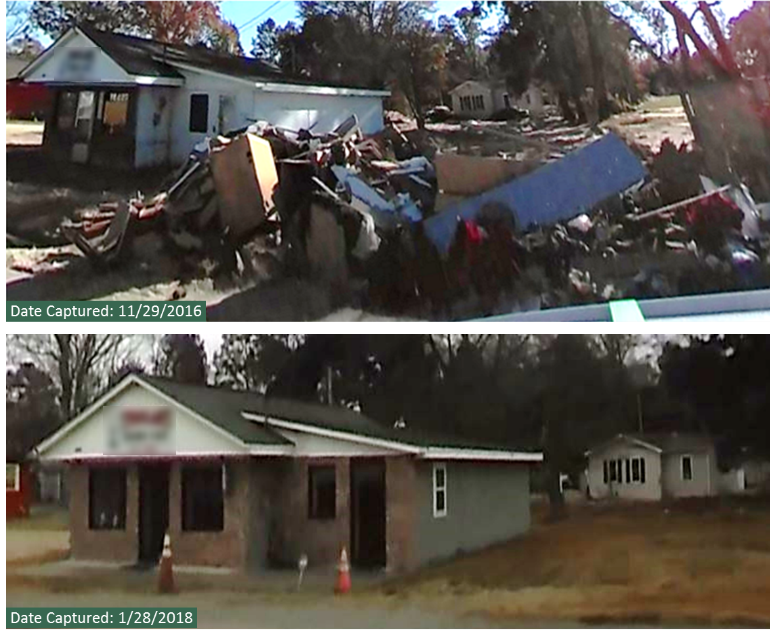
The CoE Field Study team selected Lumberton for many reasons, including the moderate population size of 21,542 residents, the diverse socio-demographic makeup of primarily three race and ethnicity groups (White, Black, and Lumbee Indian), and the fact that flood waters entered the City through a gap in the levee system that just 13 years prior was reported to not meet the current FEMA regulations. Thus far, the CoE has performed two waves of data collection in Lumberton. Wave 1 was just one month after the flood during the week of November 29, 2016. Wave 2 was approximately one year after the flood during the week of January 21, 2018. This update focuses on Wave 2; background information is provided as necessary for Wave 1; next steps are provided at the end.
The primary goal for Wave 1 was to assess the initial damage to physical infrastructure and disruption to the social and economic systems. The residential sector was selected as our target. Damage to housing was assessed through detailed engineering evaluations. Utility disruption, household dislocation, work and school interruption were gained through structured surveys performed with households via a stratified random sample of housing units. The primary goal of Wave 2 was to investigate what comes after the initial damage, dislocation, and socioeconomic impacts, and to collect the necessary data to capture the process of recovery. Wave 2 had two primary objectives to support ongoing research within and across the CoE:
Objective 1: document community interdependencies through data collection;
Objective 2: document recovery through data collection.
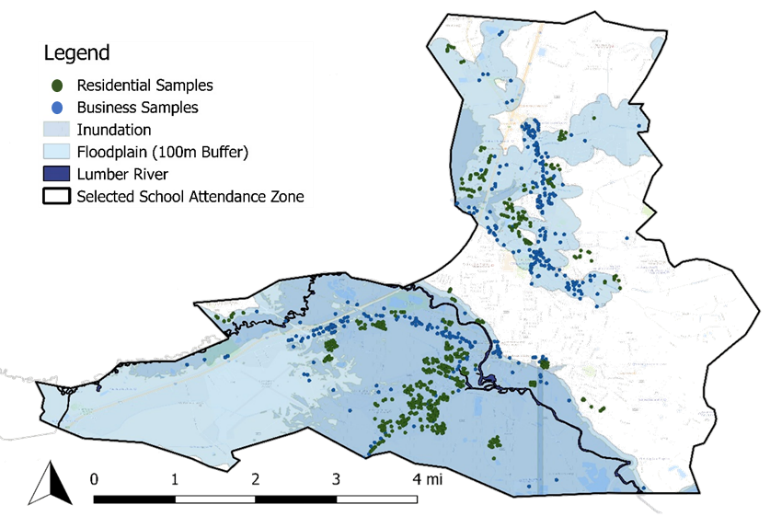
Housing was again selected as a target. Businesses were added as a second necessary target. Figure 2 provides the sampling map of the residential samples (green dots) and business samples (blue dots) overlying the flood inundation and floodplain.
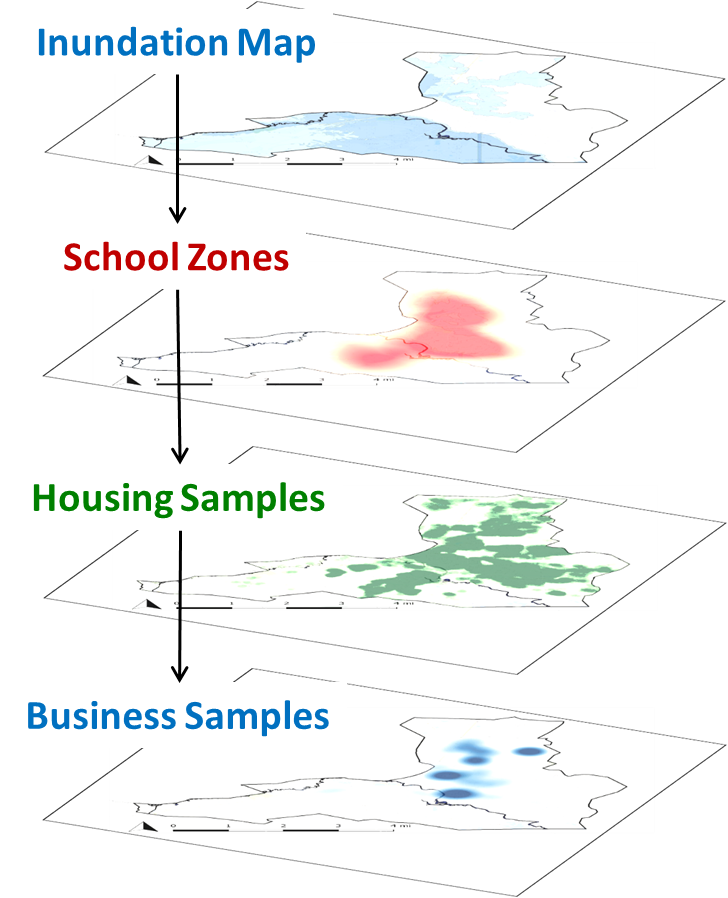
Accomplishing our objectives started with sampling (see Figure 3). The residential sampling (n = 567) was first performed for Wave 1. These samples were reused in Wave 2. The residential samples were random, but biased towards the flood inundation areas. From there, school zones were used to develop housing clusters. Then for Wave 2, the housing sampling was used to inform the business sampling (n = 350). Structured surveys were developed in unison for housing and businesses, catering to sector-specifics, and accommodating questions aimed at capturing interdependencies across housing and businesses, as well as utilities, transportation networks, and schools.
To insure sufficient documentation of recovery, survey instruments were developed through collaborative multi-disciplinary researchers across the Center team, including CoE researchers, NIST researchers, and members of the External Assessment Panel. The data collected through the structured surveys were enhanced with rich contextual information gained through semi-structured interviews conducted during both waves with representatives from the State Emergency Management Department, the City of Lumberton and their Public Works, and School District. Furthermore, to provide imagery to support findings, video was recorded through street-view cameras positioned on our vehicles during both waves. The following presents individual aims and preliminary results of the housing and business surveys.
Housing
The housing survey focused on housing damage, household dislocation, household relocation, and housing repair and recovery in place, and how each of these is influenced by housing type, tenure, socio-economics and demographics of the household, incoming recovery resources, and the influence of other community sectors in decision making. Housing recovery is very complex. To capture this complexity systematically, four housing recovery states (RS) were developed:
RS1 Repaired: All major repairs have been completed although minor repair work may remain and the residential unit may not yet be re-occupied.
RS2 Re-Occupied: The residential unit is re-occupied, but major or minor repair work may still remain.
RS3 Restored Stability: The household plans to remain in the home for at least one year; re-occupancy is implied, but minor repair work may still remain.
RS4 Restored Accessibility and Stability: Accessibility and stability have been restored; re-occupancy is implied, minor repair work may still remain.
Preliminary findings from Wave 2 towards these housing recovery states are provided in Figure 4. From Figure 4, one can see that 53% of the households we spoke with had re-occupied, but had not satisfied any of the other housing recovery criteria (repair, accessibility, or stability); 9% met all four criteria, and were in HS4. The values in Figure 4 sum to 65% indicating that 35% of households we spoke with had not reached RS1 at the time of the interview
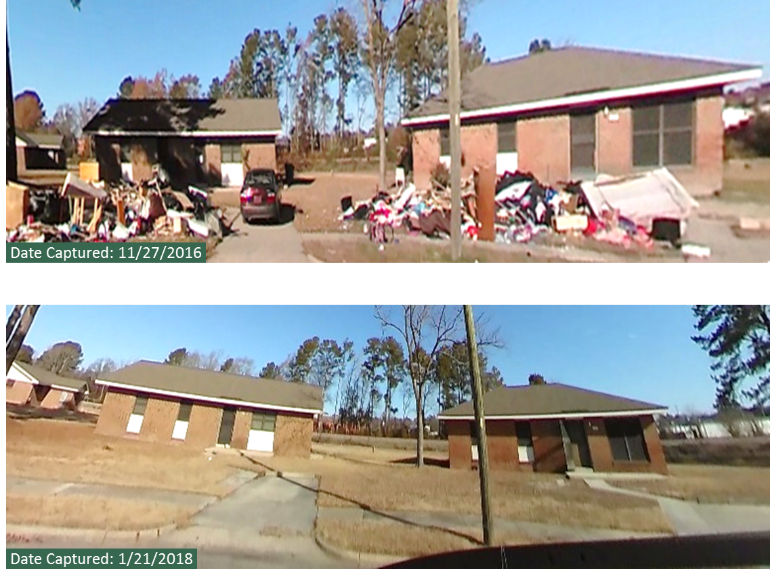
Preliminary findings from the surveys and captured through the video imagery support the well-observed standard that those most socially vulnerable are often too the most physically vulnerable thereby experiencing the most severe impacts during disasters and the longest recovery periods (see Figure 4 for one example).
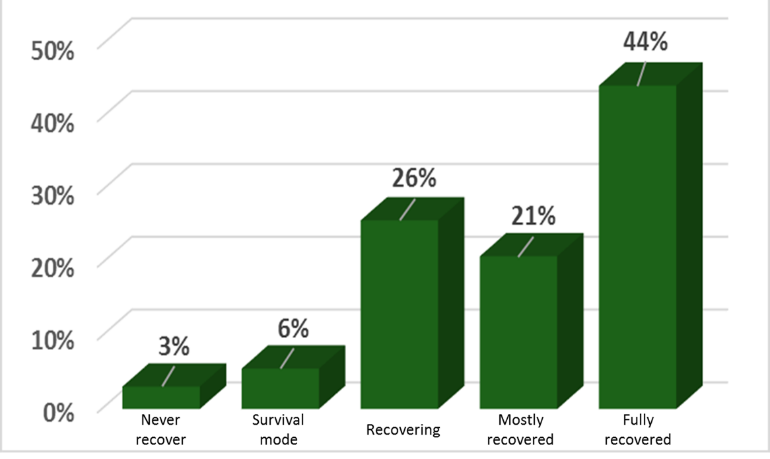
Businesses
The business survey focused on physical damage to the building, equipment and machinery, and contents and merchandise, business interruption, business closure, and business recovery, and how each of these is influenced by the size of the business measured through employees, the ownership structure, tenure, dependence on the physical space, business sector, age of the business, revenue and profitability, and the influence of other community sectors. Businesses were asked to indicate where they felt that their business was in the process of recovery: still in survival/response mode, recovering, mostly recovered, fully recovered, or still in operation but will never recover. Preliminary findings from Wave 2 towards business recovery are provided in Figure 6. From Figure 6, one can see that 3% indicated they would never recover, 6% were still in survival mode, 26% were recovering, 21% were mostly recovered, and 44% indicated that they were fully recovered by the time of the survey.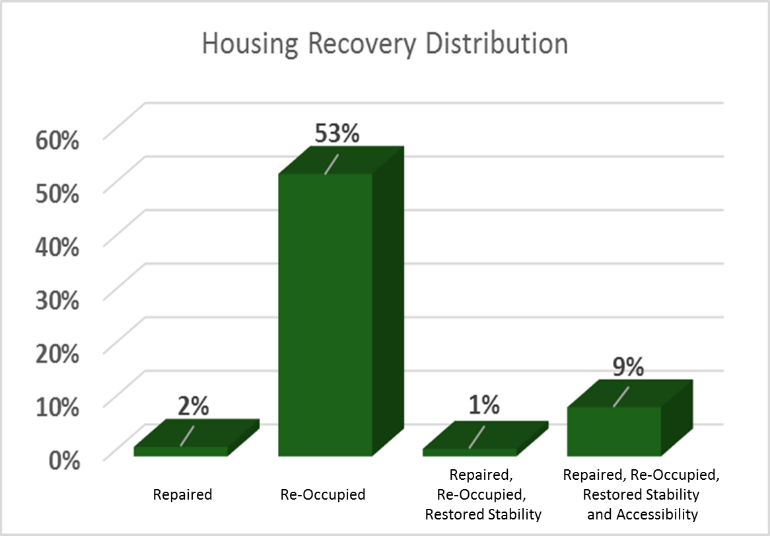
Next Steps
Preliminary findings from Wave 2 indicate that recovery is just beginning for both housing and businesses. This is also very true for the school system, although not captured in this short update. Wave 2 survey instruments were successful in meeting the objectives of documenting community interdependencies and recovery progress, at least to the extent that recovery progress had occurred at the 1 year mark. This work requires additional measurement through time. Wave 3 planning is to start in August; project team members are needed.
Wave 1 Report The Lumberton, North Carolina Flood of 2016: A Community Resilience Focused Technical Investigation is to be released Summer 2018.
Acknowledgment
The Lumberton team consists of nearly 30 individuals from across the Center, NIST and the External Assessment Panel. Without the continued engagement and efforts of all of these members, the field studies would not be nearly as successful as they have been in their rich study design, expansive data collection, or exhaustive analysis.

References
NOAA National Centers for Environmental Information (NCEI) U.S. Billion-Dollar Weather and Climate Disasters (2018). https://www.ncdc.noaa.gov/billions/
Integration of Physical and Social Infrastructure Systems in Community Resilience, December 2017 Task of the Month
by Roberto Guidotti1,3, Nathanael Rosenheim2,3, and Paolo Gardoni1,3
1 Department of Civil and Environmental Engineering, MAE Center, University of Illinois at Urbana-Champaign, Urbana, IL, USA
2 Department of Landscape Architecture and Urban Planning, Texas A&M University, College Station, TX, USA
3 NIST Center of Excellence for Risk-Based Community Resilience Planning, Colorado State University, Fort Collins, CO, USA
Extreme natural events have revealed the vulnerability of communities and their slow recovery. The damage to physical infrastructure (water and wastewater, electric power, transportation and telecommunication networks) can lead to significant societal impact and highlights the importance of physical networks as they support population well-being. A critical step in the reliability and resilience analysis of a community is a proper understanding and model of the complex interdependency among physical and social infrastructure systems. After a disrupting event, physical infrastructure may not be able to satisfy pre-event demands, and the post-event demands are challenging to model because of the uncertainties in the human behavior/response (i.e., population evacuation or the decision to relocate.) Population characteristics are not uniformly or randomly distributed within communities, therefore spatially locating their significant variations is critical to model human behavior/response and in turn hazard impacts and recovery. Furthermore, researchers have recognized the importance of data integration for community resilience models that capture differences in household response to natural or anthropogenic hazards.
A probabilistic procedure has been developed by the Center of Excellence to integrate physical and social infrastructure systems (Guidotti et al. 2017, and Rosenheim et al. 2017). The developed probabilistic procedure is illustrated in Figure 1 with reference to the potable water network of Seaside, OR a coastal community with a population year-round of 6,000 and an estimated summer population of 14,000 people, subject to a seismic event. The detailed population data includes demographic information and represents the state-of-the-art for modeling social response to disruptions in critical infrastructure. The procedure is general and applicable to different communities, networks, and hazards.
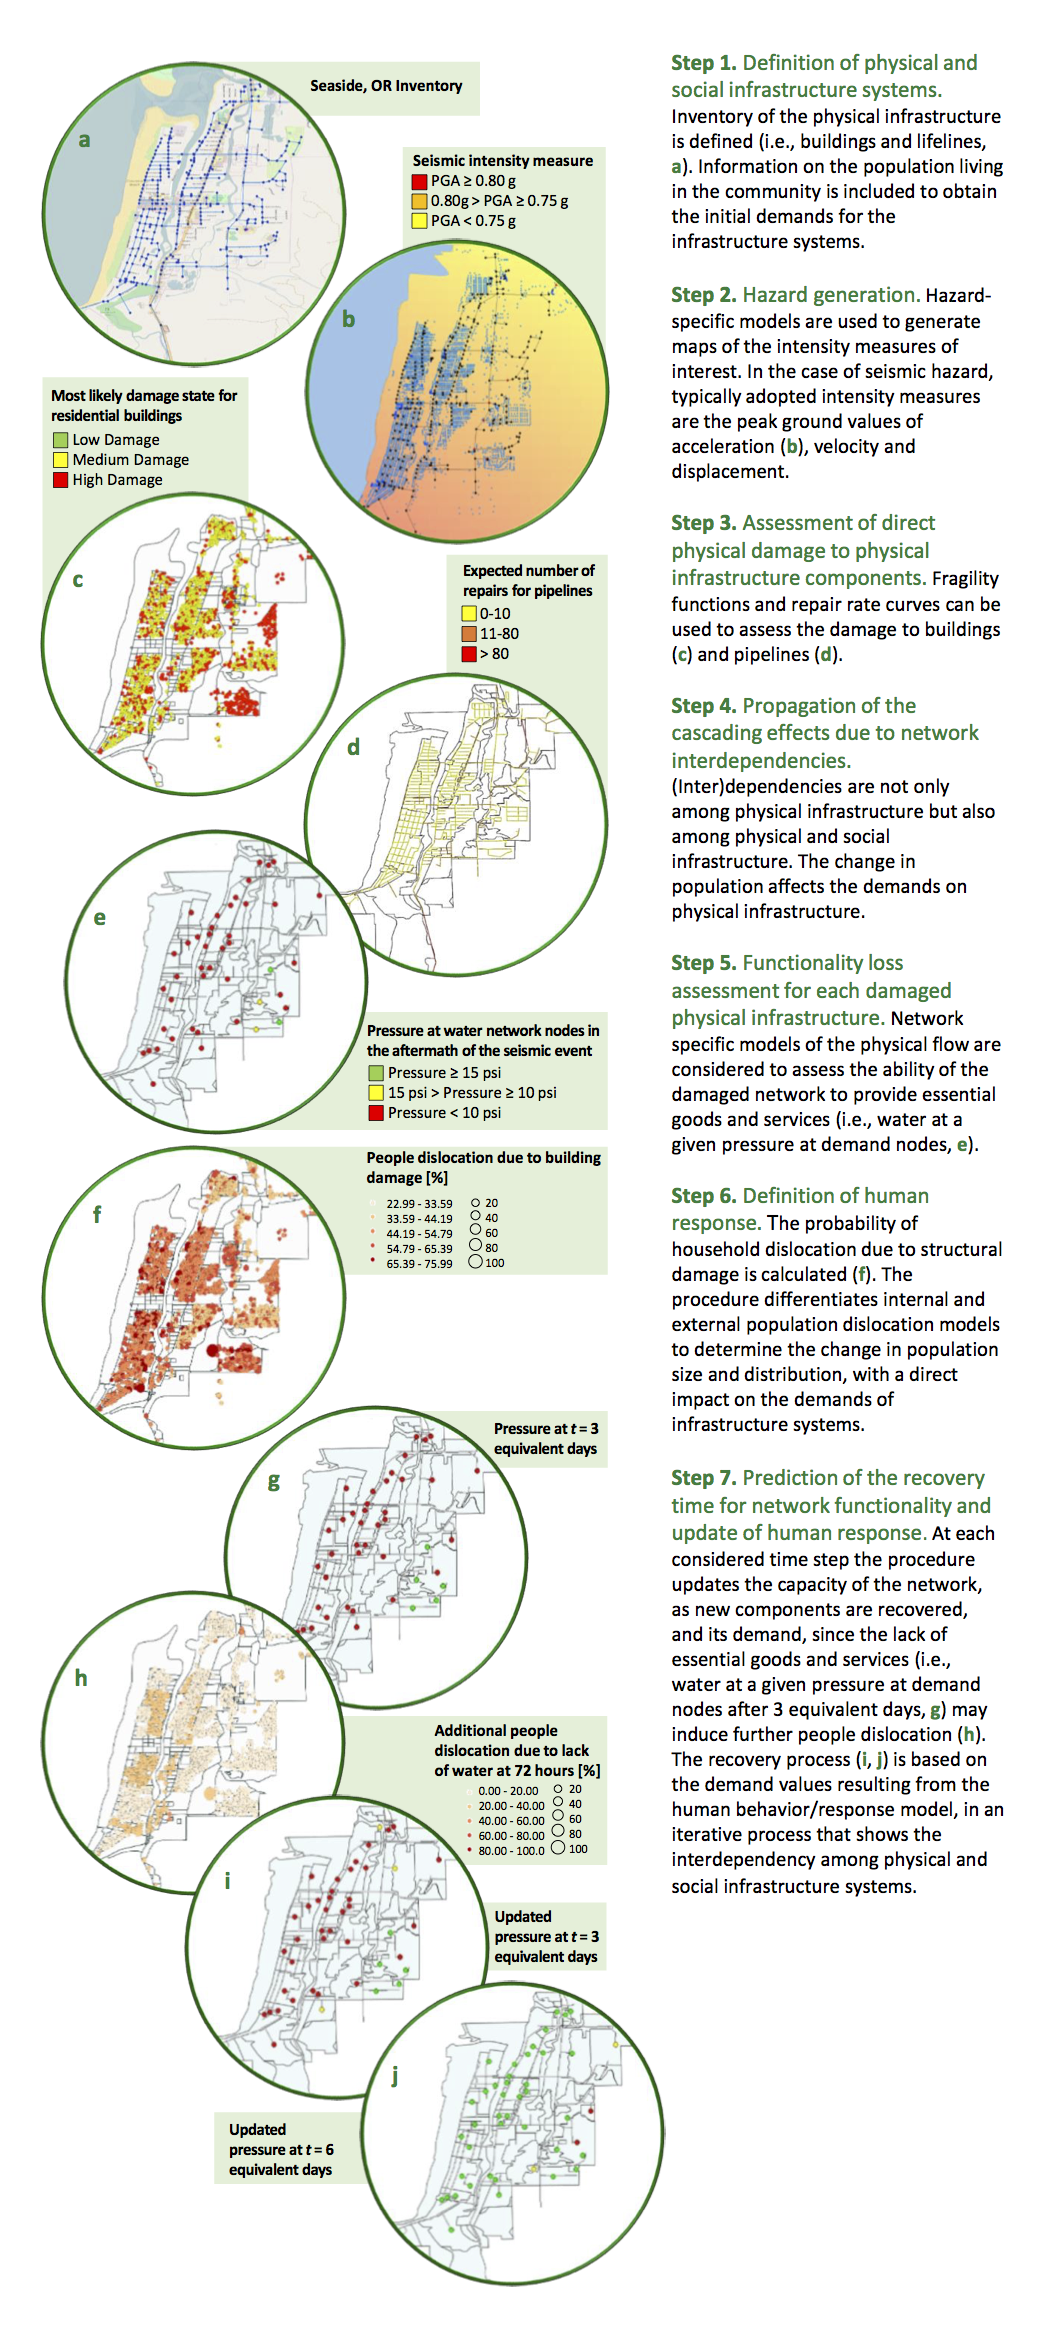
Figure 1 illustrates an iterative process that shows the interdependency among physical and social infrastructure systems. Considering the example of Seaside, OR we can see that
- To disregard the information from the human behavior/response model might result in higher estimates of the demands on the physical systems, which in turn can lead to an estimate of a slower recovery process; and
- To disregard the effects of the lack of essential goods and services in the human behavior/response model (i.e., considering only the effects of the structural damage to buildings) might result in an estimate of a lower population dislocation.
- Guidotti, R., Rosenheim, N., and Gardoni, P. (2017) “Integration of Physical and Social Infrastructure Systems and Its Implementation to the Modeling of Potable Water Networks,” Reliability Engineering & System Safety (in preparation).
- Rosenheim, N., Guidotti, R., and Gardoni, P. (2017) “Integration of Detailed Household Characteristic Data with Critical Infrastructure and Its Implementation to Post-Hazard Resilience Modeling,” Sustainable and Resilient Infrastructure (in preparation).
Hindcasting the Joplin Tornado in IN-CORE v 1.0, September 2017 Topic of the Month
by John W. van de Lindt, Hussam Mahmoud, Navid Attary and Stephanie Pilkington
Additional Task Team Members: Steve Smith, Sammy Zahran, Harvey Cutler, Martin Shields, Elaina J. Sutley, Sara Hamideh, Walter Peacock, Nathanael Rosenheim, Yu Xiao, Lori Peek, Maria Koliou, Andrew Graettinger, Suren Chen, Mehrdad Memari, Stephanie Pilkington, Hassan Masoomi, Jennifer Tobin-Gurley, Todd Clapp, Derya Deniz, Shane Crawford, Christopher Navarro, Jong Sung Lee and Yong Wook Kim.
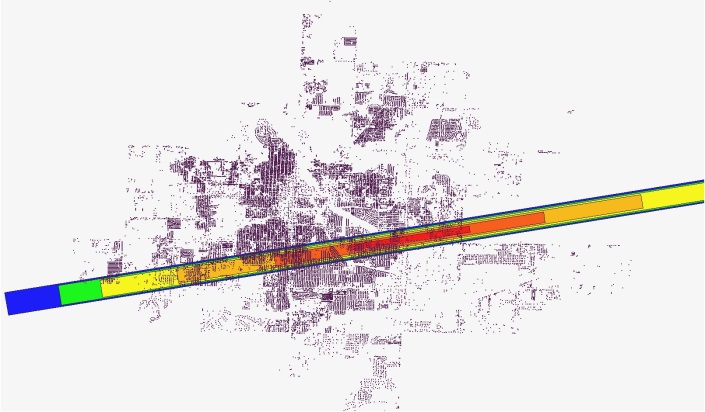
The objective of the hindcasting task is to systematically validate the accuracy of IN-CORE modeling approaches of individual physical sectors, coupled sectors, social and economic sectors, and full events. The first hindcasting for the Center of Excellence has been focused on the Joplin tornado. On May 22nd 2011, an EF-5 tornado (rated based on the Enhanced Fujita tornado intensity scale) cut more than a 6-mile path of destruction through the city of Joplin, MO. With wind speeds of more than 200 mph, the ¾-mile-wide tornado caused 161 fatalities, approximately 1,371 injuries and more than $2.8 billion in losses, making it the deadliest and costliest single tornado in the country since 1947. It should be noted that Doppler radar, and thus early warning for tornadoes, did not exist in 1947 as it did in 2011. The Center of Excellence (CoE) team visited the City of Joplin and gathered a large amount of existing data from before and after the tornado to be able to hindcast (and for comparison) the event and has conducted (or is conducting) analysis with the following tornado types as part of this sub-task.
- Tornado Type 1: A generic EF5 tornado will be applied with mean width and length
- Tornado Type 2: A generic EF5 tornado with random width and length.
- Tornado Type 3: The actual tornado centerline with mean width and length form NOAA data set.
- Tornado Type 4: The actual tornado centerline and EF regions as determined from NIST NCSTAR 3 (2014). This type of tornado provides the majority of the hindcasting information for models and methods being developed within the CoE.
Each of these tornado types will be applied to a series of analyses by a number of CoE researchers, which includes the 11 analyses types outlined below. Each will include comparison to existing data collected either immediately following the event or during Joplin’s path to recovery, by the Task team and others in the community.
Analysis 1. Building damage analysis: Building fragilities will be combined with the tornado wind speeds to provide a probability of each building in Joplin being in one of four damage states, namely Slight, Moderate, Extensive and Complete.Analysis 2. Electrical Power Network (EPN) damage and loss of functionality: Damage to the EPN and loss of functionality using a modified cellular automata model.
Analysis 3. Coupled building and EPN functionality: A combination of Analyses 1 and 2 for building functionality.
Analysis 4. Business disruption: An analysis showing the loss of businesses.
Analysis 5. Computable generalized equilibrium of the economy with Quarterly Census of Employment and Wages (QCW): A detailed assessment of the economic impact of the tornado.
Analysis 6. Recovery of functionality for buildings: This is an isolated building repair analysis of Joplin, assuming permits and crews are available.
Analysis 7. Economic recovery including domestic supply, household income and employment: A Computable General Equilibrium (CGE) analysis to estimate the economic recovery without any integration of the physical infrastructure.
Analysis 8. Recovery of economy with annual updating of physical infrastructure recovery: Same as Analysis 7 but with annual updates to the building functionality.
Analysis 9. Population dislocation using small area model: Estimate of the number of household dislocated by the tornado.
Analysis 10. Housing recovery model comparison to Joplin recovery data (parcel method): Prediction of housing recovery using improvement value as a proxy.
Analysis 11. Housing recovery model compared to Joplin recovery data (building cluster approach): Apply a discrete state continuous Markov Chain approach to generate restoration curves, ultimately predicting the recovery time.
The majority of these analyses are underway with several waiting on data or information to proceed.
Building Damage Analysis
As an example of some of the completed and ongoing analysis, the engineering team at Colorado State University completed a building damage analysis in collaboration with IN-CORE programmers at the National Center for Supercomputing Applications (NCSA). Pre-disaster details of all of the buildings in the city of Joplin were gathered and imported into IN-CORE and the four tornado scenarios mentioned previously, were simulated in the software. Figure 1, shows two of the scenarios as an example.
 |
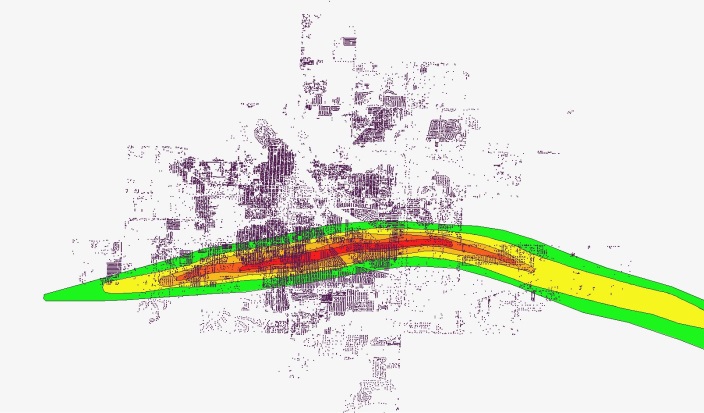 |
Figure 1. Buildings in the city of Joplin, modeled in IN-CORE for two tornado scenarios: a generic EF5 tornado (left) and actual tornado centerline with EF regions (right) (Attary et al., 2017a)
In order to estimate the damage caused by the scenario tornadoes, the engineering team at CSU categorized the buildings in the community into 19 archetypes and developed tornado fragilities for each type (Memari et al., 2017). Each one of the 19 fragilities was assigned to each building in the city of Joplin. Figure 2, shows the different building types (different colors in the figure), assigned to more than the 40,000 buildings throughout the city. Using the wind speed for each building during the various tornado scenarios, combined with the fragilities, the probability of damage to each building was estimated for different damage states, using IN-CORE (Attary et al., 2017a). The results of this analysis were used as inputs for other analyses (analyses 3 – 11) which are currently under development by Econ/Social team.
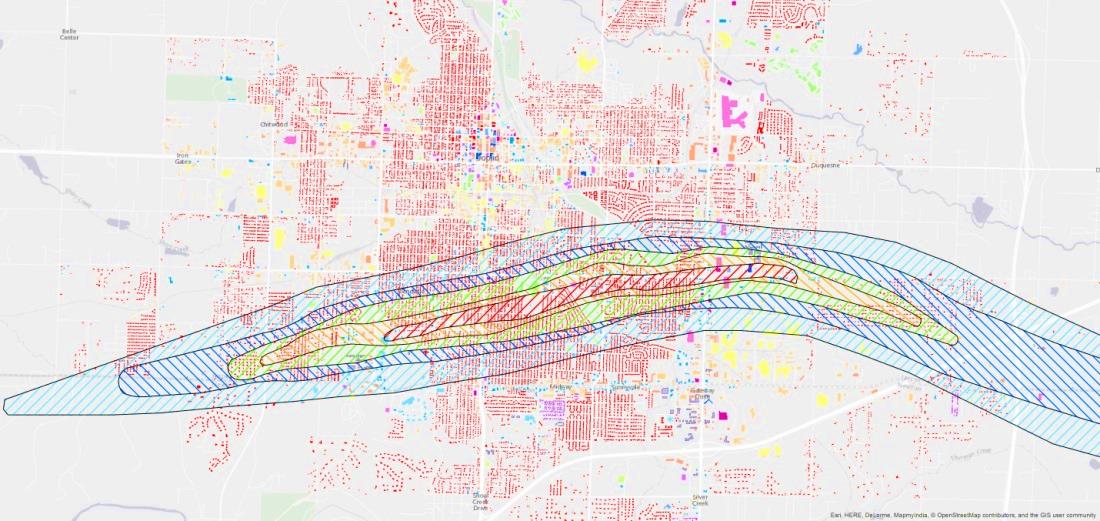 |
Figure 2. 19 architype buildings in the city of Joplin and the actual tornado path and EF zones
Electrical Power Network Damage and Power Loss
Detailed pre-disaster data, including substations, transmission lines, distribution lines, etc. of the Electrical Power Network (EPN) for the city of Joplin was graciously provided to the engineering team at CSU by Empire Electric Co. Figure 3, shows the details of the EPN overlaid the actual tornado path.
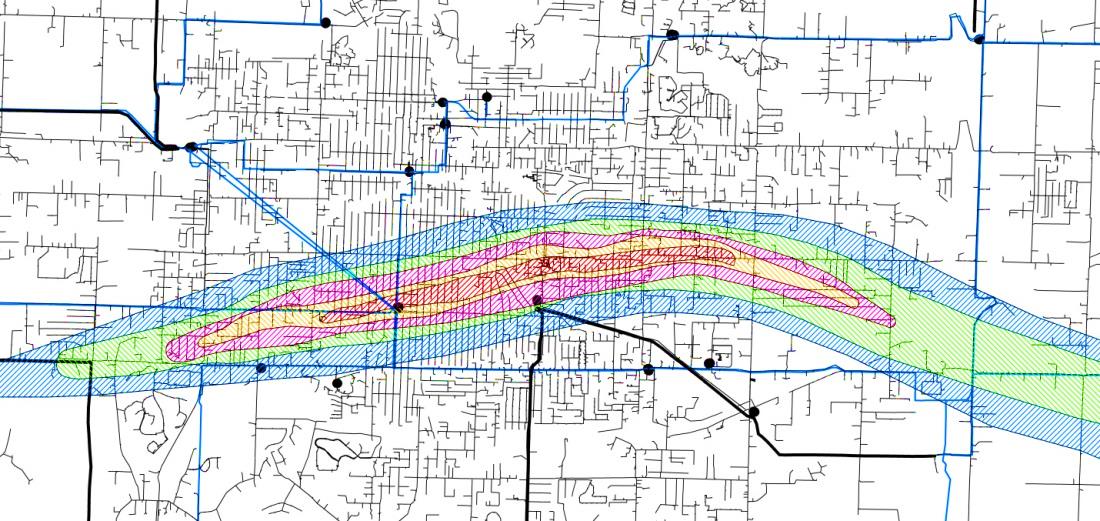 |
Figure 3. Details of Electrical Power Network of the city of Joplin (Provided by Empire Electric Co.)
In order to estimate the electric power loss after the disaster, it is critical to know the service areas of the substations, connectivity of the electrical poles and the path that delivers electric power to each customer. A weighted cellular automata technique was used by the engineering team at CSU to estimate these parameters and the results, combined with fragilities of electrical poles and towers to estimate the probability of power loss for all of the buildings in Joplin (Attary et al., 2017b). The results were compared with actual power loss reports after the event and although many power loss reports were located outside of tornado path, the results were promising (Attary et al., 2017b). The probabilistic results of electric power loss were then combined with the results from the building damage assessment discussed previously, to provide coupled building and EPN functionality (Attary et al., 2017b), immediately following the tornado. Detailed results of the analyses will be presented during the CoE semi-annual meeting at Gaithersburg this November.
Acknowledgment
The team would like to thank Mike Fobair and Tina Gaines from Empire District Electric Co. for their help in providing data of the electrical power network. The team would also like to thank Dr. Steve Smith from the Department of Geography at Missouri Southern State University for helping facilitate many logistical issues during the field study and for providing various technical insights, particularly with regard to GIS.
References can be found on the Center of Excellence Publication Listing web site.
Buildings: Toward Hazard-Resilient Community Building Portfolios, January 2017 Topic of the Month
Naiyu Wang, Peihui Lin, John W. Van de Lindt, Maria Koliou, Hussam Mahmoud, Emad Hassan, Bruce Ellingwood, Derya Deniz, Mikhail Gershfeld, Giuseppe Lomiento, Andre Barbosa and Dan Cox
The overall objective of the building task is to study community buildings at both individual and portfolio levels at different resolutions to: (1) provide IN-CORE with building fragility functions, for both damage and functionality states, and for existing and new constructions; (2) support implementation of a multi-dimensional building classification system in IN-CORE; (3) model the building portfolio recovery process (in collaboration with COE Social and Econ Teams); (4) facilitate the interdependency modelling between buildings and utility networks; and (5) develop decision frameworks to inform resilience-based design, risk mitigation and recovery strategies for building portfolios.
Building Portfolio Analysis
In building portfolio analysis, we analyse building inventories from a system perspective, emphasizing the need to embrace uncertainty and to communicate risk between different disciplines. We have developed a framework for analysing response and recovery of building portfolios subjected to earthquakes, as shown in Figure 1, including specifically formulations for: (a) probabilistic building portfolio damage and direct loss estimation, considering the positive correlations in seismic demands due to common hazard with large footprint and in building capacities due to common design, construction practice and code enforcement [Lin & Wang, 2016]; (b) probabilistic spatial distribution of post-earthquake building portfolio functionality loss considering utility disruptions, by coupling a state-of-the-art minimum cost-based network interdependency model with a comprehensive building portfolio damage analysis procedure [Zhang et al, 2016]; (c) stochastic modelling of building portfolio recovery by integrating the physical process of individual buildings' repair with the community-level considerations of resources, preferences, and social-economic characteristics [Lin & Wang, 2017a, 2017b], (d) multi-objective decision algorithms to optimize pre-event building portfolio retrofit strategies that support overall community resilience objectives [Lin et al, 2016]; and (e) interface modelling between building portfolio damage estimation and economic impact prediction using computable general equilibrium (CGE) models [Cutler, 2016], which supports on-going investigation of effective non-engineering risk mitigation solutions for community building portfolio resilience planning. Figure 2 highlights the building portfolio analysis for Centerville testbed community.
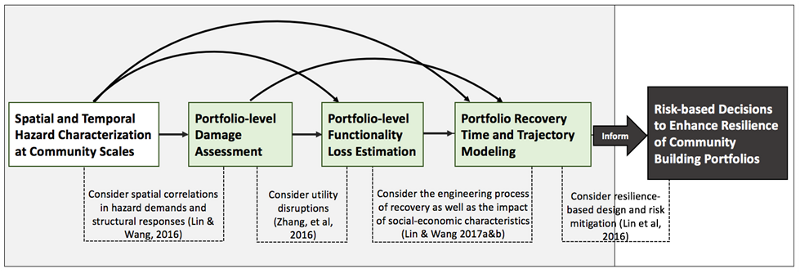
Figure 1. Building portfolio analysis to inform risk-based resilience planning.
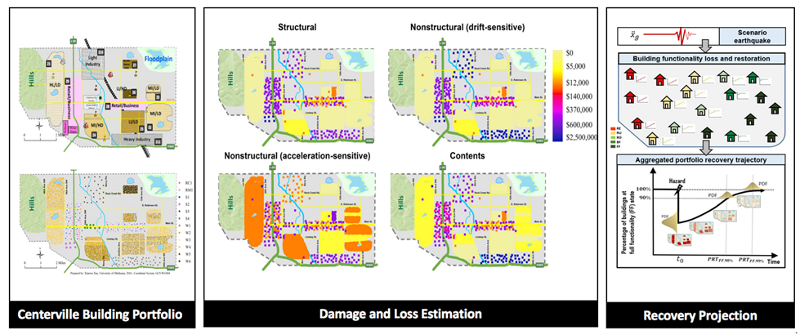
Figure 2. Centerville building portfolio analysis [Lin and Wang, 2016; 2017a&b].
Individual Building Analysis
Damage fragility analysis
Building fragility functions that relate the physical damages of structures to the hazard intensities play a crucial role in the hazard-specific risk modeling of both individual buildings and building portfolios. The fragility modeling in Center research is based on advanced analytics, statistical analysis of post-disaster in situ surveys, or a combination of the two approaches. Significant progress has been made on updating the IN-CORE fragility function database, including, for wind loads: (i) damage and loss fragilities for wood residential buildings (5 archetypes), (ii) damage fragilities for tilt-up big-box buildings (4 archetypes) [Koliou, et al, 2017a], (iii) for masonry school structures [Masoomi and van de Lindt, 2016], and (iv) for steel frame industrial facilities, strip malls, fire stations, office buildings, and a hospital (will be published in a forthcoming paper); for tsunami hazard, damage fragility functions to account for different intensity measures for steel frame buildings [Attary et al, 2016, 2017]; For earthquake hazard, (i) updated damage fragility for wood frame residential buildings to account for modelling uncertainties per FEMA P695 methodology; and (ii) damage and loss fragilities for tilt-up big-box buildings [Koliou et al, 2016], (iii) for a hospital, as shown in Figure 3, [Hassan and Mahmoud, 2016], and (iv) a steel office building. Finally, for flood hazard, an assembly-based model (shown in Figure 4) to predict flood damage, loss and repair time for residential buildings is being developed. [Deniz et al., 2017a and 2017b].
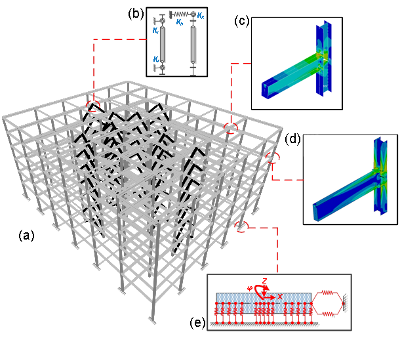
Figure 3. (a) Hospital building configuration, (b) Buckling restrained brace model, (c) Rigid connection model, (d) Semi-rigid connection model and (e) Soil-structure interaction model [Hassan & Mahmoud, 2016]
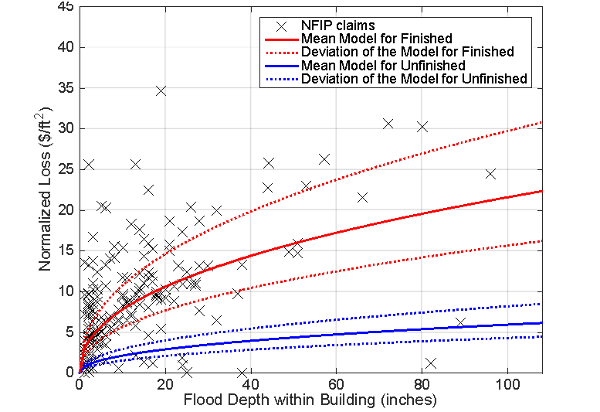
Figure 4. Comparison of the assembly-based flood loss models for basements with 'average' finish quality to NFIP claims collected for Boulder, CO. [Deniz et al., 2017b] [The scatter in the data points is typical of variability in loss estimates seen in studies for natural hazards and needs to be accounted in the loss models, which is currently being investigated by means of stochastic tools.]
Building functionality modeling
A methodology to model building functionality for use within broader community modeling was also developed [Koliou et. al, 2017b]. The methodology is comprised of four steps which, in essence integrate Performance-Based Engineering (PBE) concepts into the context of community resilience for buildings and combine them with repair and functionality analyses to allow building functionality to be quantified. This is accomplished through a series of multi-layer Monte Carlo simulations. Functionality analyses are first performed for each major component in the building including both structural and non-structural components (sub-assembly level); the results are combined in the form of statistical distributions to quantify the building (system) functionality. The building functionality methodology developed is conceptually shown in Figure 5. The proposed methodology has been implemented for a typical tilt-up concrete industrial building subjected to earthquake excitation, and is currently used to develop functionality fragility curves for a portfolio of building archetypes (residential, industrial, commercial and critical facilities) under extreme wind loads (i.e. tornadoes).
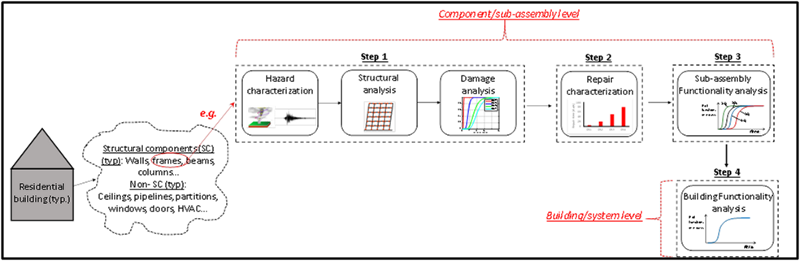
Figure 5. Conceptual generic representation of proposed functionality methodology [Koliou & van de Lindt, 2017b]
Building Taxonomy - GEM
The evaluation of community resilience using analytical models relies on the quality of the input data capturing critical attributes of a community built environment, including buildings, transportation systems, water and power networks and others. The building inventory stands out due to its inherently heterogeneous nature. An individual building or a group of buildings could vary significantly in their occupancy, design performance goals, materials and construction quality. In physics-based building models, fragility functions are used to quantify vulnerability of buildings (damage, casualties and downtime) to various natural and man-made hazards. As a growing number of fragilities is developed, a taxonomy for a variety of building topologies at different levels of granularity is needed to manage and link them to the building portfolio within a community. One of the Center's tasks was to select an existing or develop a new building taxonomy for IN-CORE that would be essentially complete, simple and collapsible, international in scope, user friendly and hazard independent. A number of international research efforts with similar goals were reviewed, leading to the selection of the GEM-BT platform as best reflecting the Center's future research needs. The latest version, GEM-BT 2.0 (https://www.nexus.globalquakemodel.org), currently addresses eleven building attributes; additional attributes under development will focus on hybrid systems. The GEM-BT taxonomy is being implemented for Centerville and Seaside testbeds. The Center's adoption of GEM-BT is an important step toward standardization of fragilities for physical infrastructure, buildings in this case.
Reference
- Attary N., Unnikrishnan V.U., van de Lindt J.W., Cox D.T. and Barbosa A.R., (2017) "Performance-Based Tsunami Engineering Methodology for Risk Assessment of Structures", Engineering Structures (under review).
- Attary, N., van de Lindt, J., Unnikrishnan, V., Barbosa, A., and Cox, D. (2016). "Methodology for Development of Physics-Based Tsunami Fragilities." J. Struct. Eng., 10.1061/(ASCE)ST.1943-541X.0001715,04016223.
- Cutler, H., Nicholson, C., Wang, N, and Zahran, S. (2016). "Merging Economic and Civil Engineering Models to Estimate the Impact of Earthquakes." Proceedings of 55th Annual Meeting of the Southern Regional Science Association, Washington, D.C. 2016.
- Deniz, D., Arneson, E. E., Liel, A.B., Dashti, S., Javernick-Will, A.N. (2017a). "Flood Loss Models for Residential Buildings, Based on the 2013 Colorado Floods." Natural Hazards, 85(2), 977-1003.
- Deniz, D., Ellingwood, B.R., Liel, A., and Dashti, S. (2017b). "Flood Loss and Recovery Models for Residential Housing Stock: a Case Study of the 2013 Boulder, Colorado Floods." Proceedings, 12th Int. Conf. on Structural Safety and Reliability (ICOSSAR 2017), Vienna, Austria, August.
- Hassan, E. and Mahmoud, H. (2016) "Effect of Modeling Resolution on the Seismic Response of a Steel Hospital Building with Buckling Restraint Braces", Journal of Constructional Steel Research (under review).
- Koliou, M., Masoomi, H. and van de Lindt, J.W. (2017a), "Performance Assessment of Big-Box Tilt-up Buildings subjected to Extreme Hazards: Tornadoes and Earthquakes", ASCE Journal of Performance of Constructed Facilities, 10.1061/(ASCE)CF.1943-5509.0001059 (in press)
- Koliou, M., van de Lindt, J.W. and Lawson, J. (2016b), "Quantifying Post-Disaster Building Functionality for Application in Community Resilience Assessment", ASCE Journal of Structural Engineering, Special Issue on Structural Design and Robustness for Community Resilience to Natural Hazards. (under review)
- Koliou, M., van de Lindt, J.W. and Filiatrault, A. (2016), "Evaluation of an Alternative Seismic Design Approach for Rigid Wall Flexible Wood Roof Diaphragm Buildings through Probabilistic Loss Estimation and Disaggregation", Engineering Structures, 127, 31-39.
- Lin, P. and Wang, N. (2017b). "Post-disaster Functionality Recovery of Community Building Portfolios II: Implementation", Structural Safety (under review).
- Lin, P. and Wang, N. (2017a). "Post-disaster Functionality Recovery of Community Building Portfolios I: Modelling", Structural Safety (under review).
- Lin, P. and Wang, N. (2016) "Building Portfolio Fragility Functions to Support Scalable Community Resilience Assessment." Sustainable and Resilient Infrastructure. Special issue on NIST COE Centerville Testbed. Sustainable and Resilient Infrastructure, 1(3-4), 108-122
- Lin, P., Wang, N. and Ellingwood, B.R. (2016) "A Risk De-aggregation Framework that Relates Community Resilience Goals to Building Performance Objectives." Sustainable and Resilient Infrastructure. Volume 1, 2016 - Issue 1-2.
- Masoomi, H., and van de Lindt, J.W. (2016) "Tornado Fragility and Risk Assessment of an Archetype Masonry School Building." Engineering Structures 128, 26-43.
- Zhang, W, Lin, P., Xue, X. , Wang, N. and Nicholson, C.(2016) "Probabilistic Prediction of Post-disaster Functionality Loss of Community Building Portfolios", ASCE Journal of Structural Engineering, Special Issue on Structural Design and Robustness for Community Resilience to Natural Hazards.(under review).
Interdependency Team Update: Characterizing Interdependency
Eun J. Cha, Xian He, Jose Leon Machado, Dorothy Reed and Stanley Wang
Introduction:
The civil infrastructure of a modern community is highly interdependent. Accurately capturing the influence of this interdependency is critical to understanding the performance of the infrastructure in the event of a hazard. The concept of "interdependency" within IN-CORE has been explored as a "relationship" among the components that comprise the civil infrastructure whether they are modeled as networks or systems. The role of interdependencies in maintaining infrastructure performance changes for pre-event, during and post-hazard event conditions. For the IN-CORE platform, the network systems are specifically (1) electric power network (EPN), (2) communications (T) and (3) water treatment and supply (W). The numerical models derived for interdependency are based on the characterization of the operation or functionality of these infrastructure components, networks or systems, which represent different spatial scales. Our team has modeled the dependencies and interdependencies using directed graph networks [Unnikrishnan & J. van de Lindt], unified directed graphs [Cha & He] and systems [Machado, Reed & Wang]. Because the directed graph models have been discussed in depth for Centerville, this article will focus on the unified directed graphs [Cha & He] and systems [Machado, Reed & Wang].
Unified Directed Graph Model:
Cha & He (He & Cha, 2016) have modeled the functionality of network combinations including electric power, telecommunication, and water supply for "normal" (pre-), during and post-event operating conditions. Figure 1 shows a sample schematic for the combined networks. (He & Cha, 2016) combine elements of graph theory and Dynamic Inoperability Input-Output Models (DIIM) at the nodal level.
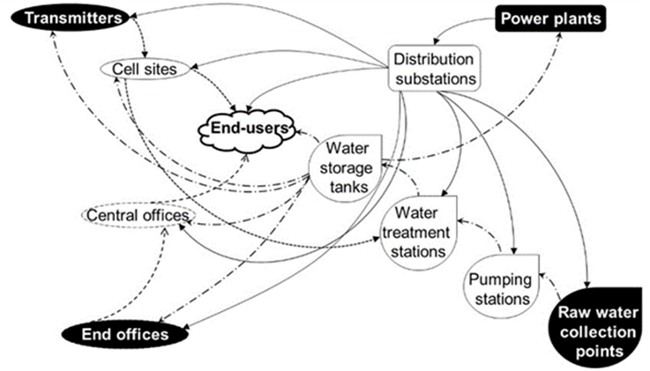
Figure 1. A schematic for the combined network of electric power, telecommunication, and water supply system.
One distinguishing feature of this approach is that the model incorporates across-system dependency at the facility-to-facility level. The dependency relationship is initially established by considering the operability failure modes of the individual facilities. By modifying the DIIM, the dependency between any two facilities is quantitatively determined by combining (1) the importance of a facility to produce a service and (2) the importance of that service in the operation (i.e. operability) of another facility. In this model, the dependency relationship is assumed to remain unchanged for both the pre- and post-disaster periods. However, the importance of the relationship in maintaining operability may change depending upon the time period.
The disruption of a facility operation is determined considering (1) the input-output requirement of each facility and (2) the relationship between the operability and the physical integrity of the facility. The inoperability of the individual facilities is calculated for each time step in a discretized time span. For each time step, the inoperability is updated by considering (1) the inoperability of all facilities, (2) the dependency among facilities, (3) the recovery rate of each facility, and (4) the demand change placed upon the individual facilities. The operability of each individual facility is combined together with all others to quantify (1) the operability of each lifeline system, and (2) the operability of the whole network by using characteristic parameters defined in graph theory. Outputs of this unified directed graph model include the inoperability characterization over time for individual facilities, individual lifeline systems, and the integrated network. Figure 2 illustrates the general procedure for estimating the network operability described above.
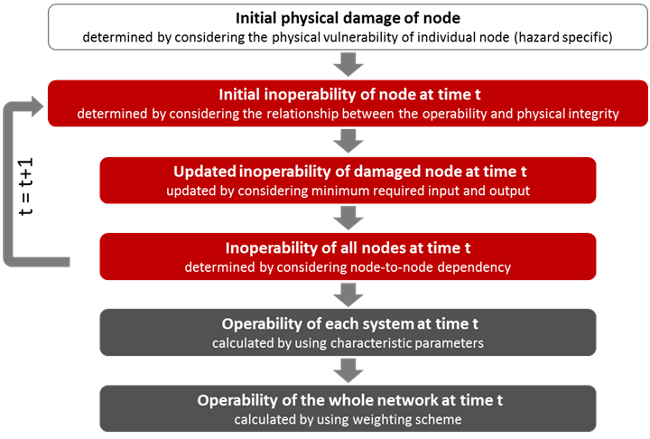
Figure 2. General procedure for measuring the operability of individual facilities, individual lifeline systems, and the integrated network.
The methodology has been developed to be generally adaptable for various circumstances and it is assumed that the dependency characteristics may vary by hazards and regions. In the future, sensitivity analysis of these dependency parameters will be conducted before the model is incorporated into IN-CORE. In addition, the validation of the model for a hurricane event is planned.
Recovery-based interdependency approach (RBIA):
Machado, Reed & Wang have modeled the post-event behavior of electric power and selected communications systems using functionality-based input-output models for hurricanes, earthquakes and tsunami using post-event data. Although water supply inoperability data were available for some earthquake events, the interdependency models did not prove to be successful, so independent single-degree of freedom system models were explored for these fits.
The RBIA model for a two system infrastructure model is shown in Figure 3.
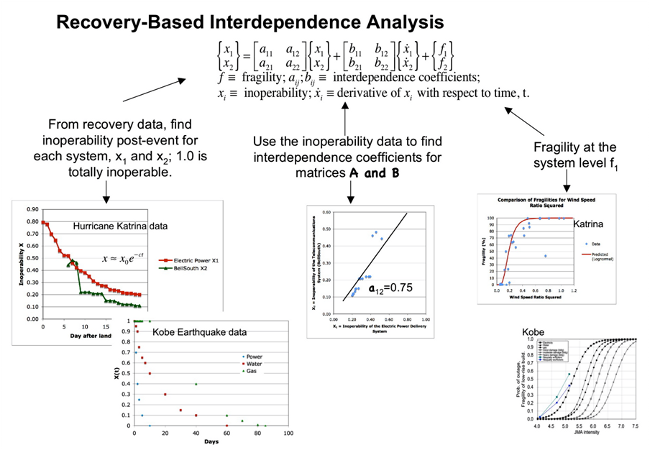
Figure 3. RBIA methodology for a two system network.
This approach uses recovery data for each system to characterize fragilities, recovery over time described by inoperability X(t), and interdependencies. The interdependencies are in the form of a matrix A with elements aij. , which represent the influence of the inoperability of system "j" on system "i". It is anticipated that as recovery data for numerous systems under multiple hazards have been analyzed, the model may be implemented "in reverse" to predict recovery behavior; that is, the SDOF parameters will be estimated based upon the hazard event information and the initial damage and recovery over time will be predicted for input scenarios.
In this model, fragilities at the system level are fitted to post-event data using logistic regression models e.g. (Reed, Friedland, Wang, & Massarra, 2016). Although the model had been fit to post-event data in the past, predictive models for the IN-CORE testbeds for tsunami and earthquake events will need to be determined. Using the RBIA, our team fitted system-level recovery curves to post-event seismic and tsunami damage data published by (Duenas-Osorio & Kwasinski, 2012) for the Maule, Chile earthquake of February 27, 2010 shown in Figure 4 and the Japan 2011 earthquake data provided by (Nojima & Kato, 2014) shown in Figure 5. Because the PGA data for these events are available as shown in Figure 6 (USGS , n.d.), we will investigate the modeling of system-level fragility curves for these data and estimate relationships between the SDOF parameters and the PGA demand variable as well as investigate relevant tsunami water depth GIS data (NOAA NGDC/WDS Tsunami Event Database, n.d.).
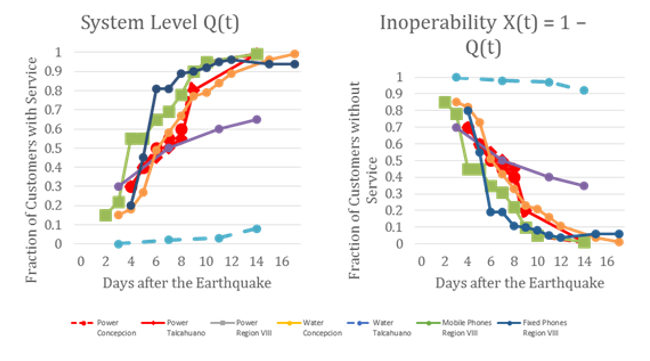
Figure 4. Chile recovery data, Source: Duenas-Osorio and Kwasinski (2012).
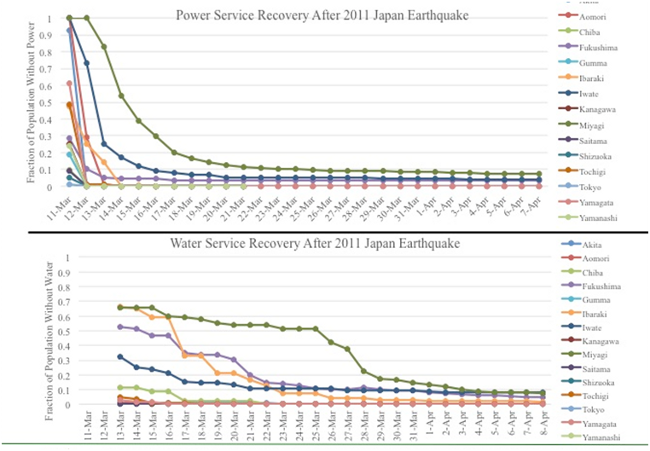
Figure 5. Japanese inoperability recovery for Japan 2011 Earthquake, Source: Nojima & Kato (2014).
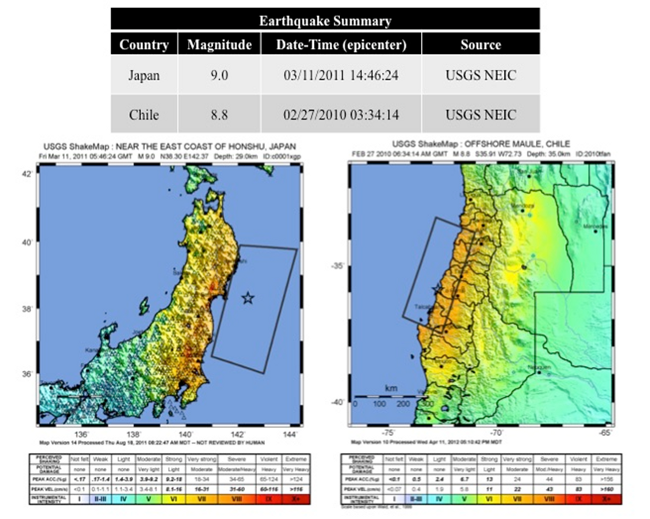
Figure 6. shakemap data for Chile 2010 and Japan 2011 events.
In the future, elements of the RBIA will be implemented within the unified directed graph approach. In this manner, calibration of real, complex network systems may be modeled for normal circumstances as well as disruptions due to natural hazards.
References
- Duenas-Osorio, L., & Kwasinski, A. (2012). Quantification of Lifeline System Interdependencies after the 27 February 2010 Mw 8.8 Offshore Maule, Chile Earthquake. Earthquake Spectra, 28(S1), S581-S603.
- He, X., & Cha, E. J. (2016). Modeling the operability of interdependent critical infrastructure systems for quantification of the integrated network resilience. EMI 2016 and PMC 2016 Conference. Nashville: ASCE.
- NOAA NGDC/WDS Tsunami Event Database. (n.d.). Tsunami Events Search. Retrieved from ngdc.noaa.gov/nndc/struts/results?bt_0=2010&st=2010&type_8=EXACT&query_8=89&op_14
- Nojima, N., & Kato, H. (2014). Modification and validation of an assessment model of post-earthquake lifeline serviceability based on the Great East Japan Earthquake Disaster. Journal of Disaster Research, 9(2), 108-120.
- Reed, D., Friedland, C. J., Wang, S., & Massarra, C. (2016). Multi-hazard system-level logit fragility functions. Engineering Structures.
- Reed, D., Wang, S., Kapur, K., & Zheng, C. (2015). Systems-based approach to interdependent electric power delivery and telecommunications infrastructure resilience subject to weather-related hazards. Journal of Structural Engineering. doi:10.1061/(ASCE)ST.1943-541X.0001395
- USGS . (n.d.). USGS Shakemap Archive. Retrieved from earthquake.usgs.gov/earthquakes/shakemap/list.php?x=1&s=1
Wildfire Propagation Model Using Probabilistic Cellular Automata
COE Team: Hussam Mahmoud and Akshat Chulahwat
Motivation
The 'wildland-urban interface' or WUI is a commonly adopted term in the research community to describe areas where wildfires and the built environment have the potential to interact, resulting in loss of properties and potential loss of life. WUI fires have become more frequent in recent years and have led to significant losses to communities worldwide. The recent May, 2016 Fort McMurray fire in Alberta, the costliest disaster in Canadian history, is a haunting reminder of the potential risk associated with WUI fires. Although most wildland fires are controlled before they can reach a community, an uncontrolled fire can spread and become hazardous to infrastructure and the community at large through direct flames and/or attack by burning embers. Once structures and residential vegetation are ignited, they too have the potential to contribute significantly to continued fire spread through the WUI community.
Proposed Fire Propagation Model
As part of the development of IN-CORE, a data-driven analytical prediction model has been developed to mimic the propagation behavior of a wildfire. The model was developed based on the theory of asynchronous cellular automata, which utilizes a specific set of rules to model propagation by convection, effect of wind, effect of topography and ember generation. The model was tested to observe its behavior under the aforementioned features. The model provides a flexible framework that is able to capture key features of fire ignition and spread; however, it can incorporate other features such as - variation in humidity and effect of fire-fighting. Due to its low processing time and flexible nature, the model, if calibrated properly, can be utilized for emergency planning purposes. In addition, the model is simplistic in nature therefore it does not require any formal training and is quite user-friendly.
Propagation by Convection
Fig. 1 shows the different stages of simulated fire growth under the effect of wind as fire initiates at a particular point and spreads throughout the area by convection only. The dark green vegetation cells represent short grass while light green vegetation represents trees. The blue areas in Figure 1 represent bodies of water. The variation in wind direction and wind speed were assumed to be given by sinusoidal functions. As seen from the simulation, the fire starts out in the direction of wind since wind speed is quite high at the beginning. As wind direction changes and wind speed decreases, the course of the fire also tends to change. When the wind speed is reduced sufficiently, the fire starts to spread in all directions and keeps on spreading randomly until the wind speed starts to increase again. This simulation shows the effect of wind on the propagation pattern as the fire is unable to spread over the entire area and is heavily influenced by the wind speed and direction.
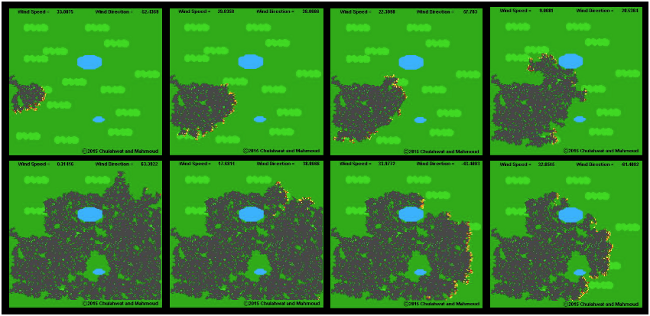
Figure 1. Simulation results for effect of wind direction and speed on wildfire propagation
Propagation by Embers
A wildfire typically propagates by 2 methods - heat transfer by convection and by embers generated from ignited sources, such as vegetation, debris and houses. Ember formation is random in nature and hence is difficult to incorporate into models, but is essential to completely understand and model wildfire propagation. Embers are able to travel long distances and start fires at locations away from the fire front, which can result in multiple fire-fronts and unpredictable fire propagation patterns. In the proposed algorithm, ember generation has been modelled probabilistically. Once an ember is generated at a particular cell, a trajectory for it is calculated based on the uplift, wind direction and wind speed at that specific time. Each ember is treated as an individual particle and the trajectory of each ember is calculated for next time step using traditional kinematics. At each time step, the trajectory for each ember is updated based on the conditions at that time. The wind speed and direction are a function of time hence they can change at every time step, and as a result, the trajectory of embers may not be a straight path. Since in the proposed model all embers are tracked, it is possible to update trajectories for each ember. While in flight, the embers can possibly collide with an incombustible object or they can collide with an ignitable object and ignite it; hence all embers are checked for collision at each time step while updating their respective trajectories. Even though the ember model may not be able to capture all the uncertainties associated with embers, it can provide sufficient accuracy because it can be tuned using on-site data.
Fig. 2 shows a simulation for propagation of wildfire by both mechanisms - convection and embers. This simulation combines all the features of the proposed algorithm i.e. variation in wind, variation in topography and ember generation. For the generation of embers, wind is a necessary condition, hence a high wind velocity was considered for this simulation. The wind direction is assumed to vary in sinusoidal fashion and the topological profile of the area considered is shown in Fig. 3. The simulation results show the effect of various factors on the propagation pattern of fire.
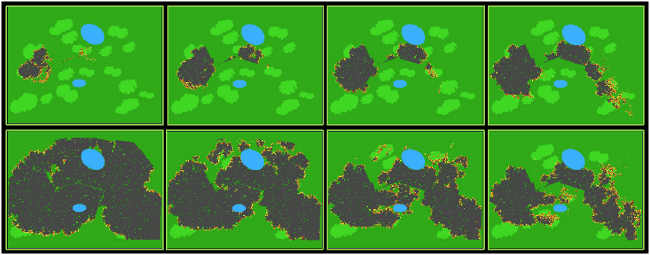
Figure 2. Simulation results of wildfire propagation by convection and embers under uneven topography and wind conditions
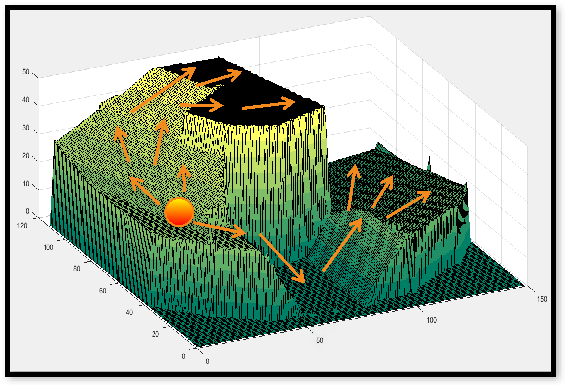
Figure 3. Topographic profile of the test simulation showing path of propagation of wildfire
The embers are generated only from the light green cells (representing trees) since embers generated by grasses would be redundant as their flight distances would be quite small. In this simulation, once the fire initiates it starts spreading and once it reaches a patch of trees it generates embers probabilistically, which in turn initiate fires at some distance away. The ember flight patterns can be observed in Fig. 4. The white cells mark the embers which have landed and orange cells represent the embers still in flight. The direction of wind varies between -60o to 60o as a result the flight path of the embers also changes corresponding to it. The embers generated tend to create new points of initiation resulting in faster propagation of fire. The embers generated by fire at lower elevations are seen to collide with the terrain and remain in the same area, however once the fire reaches the highest elevation the embers generated are able to spread throughout the area.
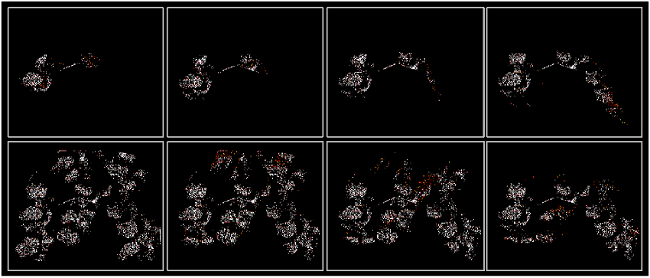
Figure 4. Simulation results showing ember trajectories and locations
IN-CORE Team Update: New and Updated Analyses in IN-CORE v1.0
COE Team: Danny Powell, Jong Lee, Chris Navarro, Nathan Tolbert, Omar Elabd, Yong Wook Kim
A software platform for multi-hazard assessment, response and planning requires a pluggable, extensible framework. This extensibility is required so that the latest and most accurate scientific models can be quickly incorporated and used by community resilience planners.
Extensibility of the framework allows new hazards and methodologies to be added or updated accordingly. These include capabilities for assessing damage to physical infrastructure such as buildings, bridges, power and water networks (including the interdependencies among these systems) as well as the socio-economic impact resulting from the physical damage.
Currently, the research is ongoing and evolving very rapidly as to better understand the physical consequences from various hazards, and the economic and social impact that can follow a disruption from a system shock. That is why the software platform must be flexible enough to allow for outdated science to be quickly replaced or for new science to be quickly added, this is needed to fill gaps where the software or science has been currently lacking.
Figure 1. Splash Screen of IN-CORE v1
IN-CORE v1.0 is built on an extensible framework that provides more than 40 analyses for performing multi-hazard risk assessment for many of the previously mentioned infrastructure. IN-CORE also provides capabilities for analyzing the socio-economic consequences from the resulting physical damage. These capabilities are being extended by research that is underway across the center to provide new hazards, fragilities and analytical capabilities to the IN-CORE platform. The primary objective of this research task is to integrate the disparate research and scientific models into a common software platform for advancing community resilience planning.
Next Generation Attenuations
While IN-CORE includes many attenuation models, the NGA (Next Generation Attenuation) models were considerably out of date. To address this, the scenario earthquake capabilities for IN-CORE have been updated to include the latest NGA-West 2 attenuation models with help from John van de Lindt and Navid Attary. Since IN-CORE is a pluggable framework, adding these new models made them immediately available for performing seismic risk assessment on all inventory types supported by IN-CORE (e.g. bridges, buildings, etc.). Consequently, dependent analyses such as building economic loss, population dislocation, etc. are also improved, since the latest earthquake models can be applied when assessing physical damage.
Roadway Damage and Restoration Analysis
With help from Jamie Padgett and Giannis Gidaris, an initial implementation for computing roadway damage and restoration time was added based on permanent ground deformation. The research team provided the methodology and required fragilities and functionality curves as well as sample calculations to verify the implementation.
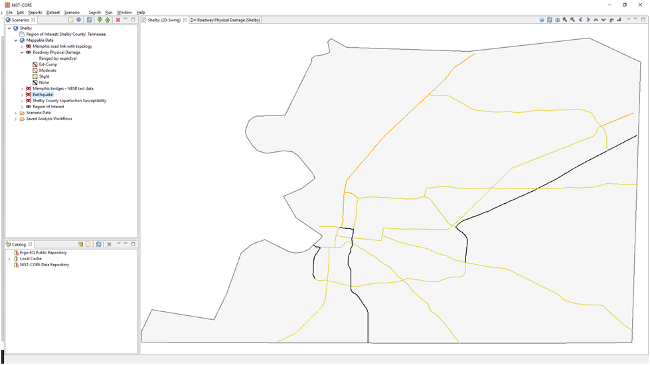
Figure 2. Roadway Damage Analysis
Tsunami Inundation and Momentum Flux
The Tsunami damage capabilities in IN-CORE were extended based on work done by Dan Cox and Hyoungsu Park. While IN-CORE originally had some capabilities for Tsunami based on inundation depth, a new data type was added for momentum flux so that either inundation depth or momentum flux could be considered for assessing building structural damage. This also required updating the Tsunami Building Damage analysis to support both methodologies. The updated analysis was tested using data from Seaside Oregon, including initial fragilities and 500 year, 1000 year and 2500 year momentum flux data provided by the research team. Additionally, an initial implementation of FEMA's model for combining Earthquake and Tsunami damage was implemented based on information provided by Hyoungsu Park.
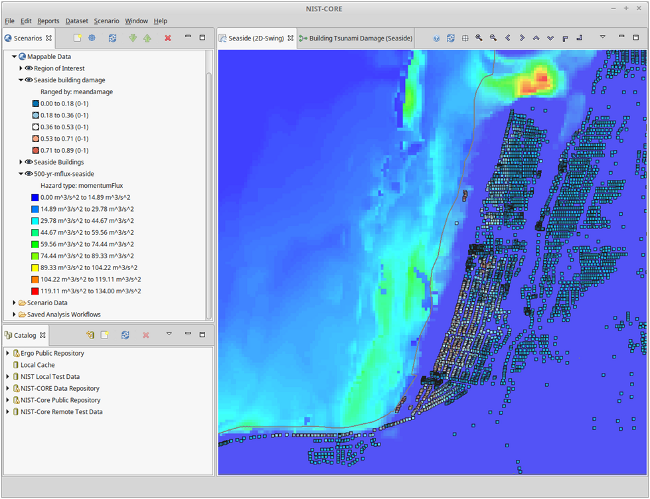
Figure 3. Building Damage Analysis due to Tsunami Hazard
Tornado Hazard Scenarios, Building and EPN Damage Analysis
Tornadoes are hazards which represent a major threat to the central part of the United States. More than 500 tornadoes typically occur in this region every year and is why it is colloquially known as "Tornado Alley". Originally, IN-CORE had no Tornado implementation. However, with help from John van de Lindt, Christine Alfano and Vipin Unnikrishnan, several models for modeling Tornado events were added to IN-CORE. These scenarios include Tornados with:
- Fixed length and angle, with mean width
- Fixed length and angle, with random width
- Historical mean length, width and angle
- Historical mean length and width, with random angle
- Random length, width and angle
The research team provided the algorithm, sample MATLAB code as well as sample building fragilities to compute building damage based on a scenario tornado event. In addition, MATLAB code, fragilities and sample electric power network data were provided for computing electric power network damage and repair cost.
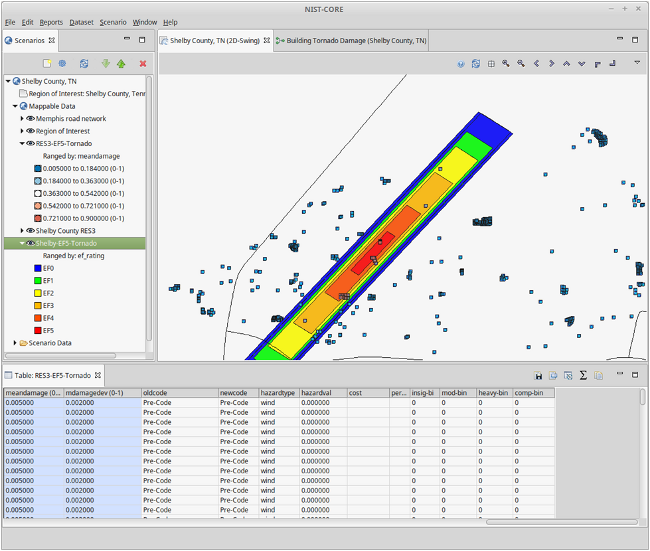
Figure 4. Building Damage Analysis Due to Tornado Hazard
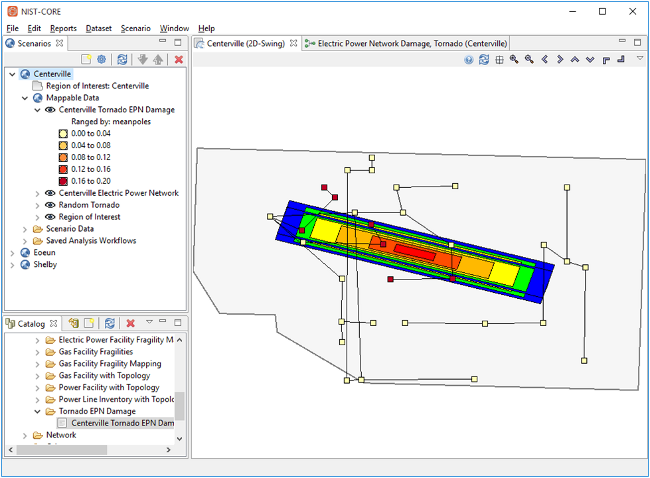
Figure 5. Electric Power Network Damage Analysis due to Tornado Hazard
Wildfire Ignition and Time-lapse Visualization
A new hazard, wildfire ignition, was also added to IN-CORE with help from Hussam Mahmoud and his research team. The team provided MATLAB code and the initial input data which was used to implement the analysis in IN-CORE. Additionally, a new visualization capability was added to show the time lapse of the fire ignition.
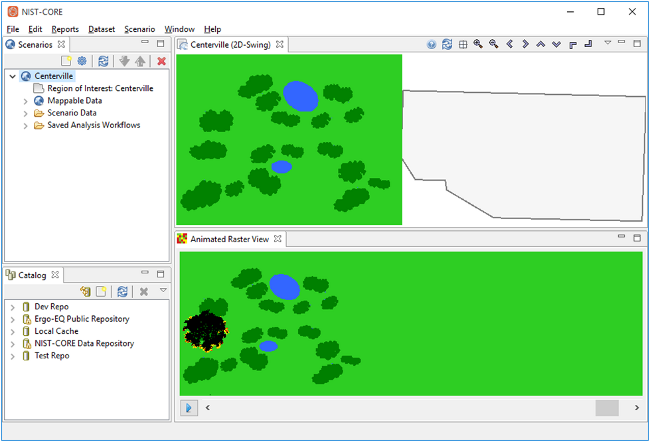
Figure 6. Wild Fire Propagation Analysis
Conclusion and Future Work
The features that were added to IN-CORE v1 demonstrate the capabilities and possibilities that the framework has for improving community resilience. As new research is published by the center, data and analyses in IN-CORE can either be updated or added (if they don't yet exist in the software). The software can also be used help researchers validate their analyses by using the visualizations available in IN-CORE to verify the results visually or by comparing with known data (e.g. hindcasting).
IN-CORE v2 is set to be developed over 2016. IN-CORE v2 will provide better data management tools, new systems for visualization, an updated user interface and much more.
Social Science Team Update: Characterizing Community
COE Team: Walt Peacock, Lori Peek, Shannon Van Zandt, Yu Xiao, Eun Cha, Elaina Sutley, Sara Hamideh, Nathanael Rosenheim, DongHwan Gu, Jennifer Tobin-Gurley, Kathleen deGennaro, and Maria Watson
Consider for a moment your community, whether it is a relatively small, rural town or a very large, complex urban metropolitan area. Our communities are comprised of a network of social systems consisting of individuals and groups such as families, households, and workers. Communities also consist of various institutions and organizations making up our economies, governmental structures, and civil society. These groups and organizations all depend upon the built environment, including buildings and infrastructure. Our work places, places of worship, schools, hospitals, grocery stores, and our homes are where we carry on much of our lives and define the space we know as our community. Furthermore, infrastructure in the form of lifelines like power and water networks enable us to run these places. And, the transportation and communication systems provide critical linkages allowing us to move people, information, and the material resources we need and consume in daily life.
Consider further how we define and characterize the physical and social geography of our community. The built environment and the people that comprise our social systems are spatially distributed in particular ways and patterned such that we can define areas like downtowns, business centers or hubs, and entertainment and arts districts. Even more so, our neighborhoods, where our homes, households, and families are located, are socially defined in particularly significant ways. Social and health science researchers have found that our neighborhoods have significant consequences for life chances related to education and economic opportunity, health, upward mobility, and importantly for our research, for housing quality and capital investment versus disinvestment. The significance of where people live for life chances is captured in their characterization as communities or neighborhoods of fate - terms that takes on special significance when addressing disaster resilience.
Defining Exposure and Vulnerability
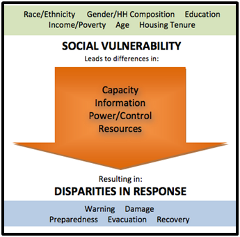
Figure 1. Social Vulnerability
The last several decades of social science research has established that hazard vulnerability or risk is generally characterized as function of hazard exposure (exposure to the forces of disaster agents), physical vulnerability (the vulnerabilities of the built environment) and social vulnerability. Hence, when modeling the social consequences of disaster such as loss of housing, dislocation and displacement, job loss, housing recovery as well as more psycho-social impacts such as post-traumatic stress disorder, the NIST-COE social science team is combining outputs from the engineering models predicting structural damage and loss of functionality based on the forces of hazard agents and the physical properties of the built environment, with social vulnerability factors. The social vulnerability perspective focuses on the social factors and processes that generate vulnerability in terms of a individual's or group's capacity to anticipate, cope, resist, and recover from the impacts of disasters. This perspective is captured in Figure 1, where the focus is on social characteristics that capture household and individual differences in capacity and assess to information, power/influence, and resources. These differentials ultimately have the consequence of disparities in disaster impacts and recovery trajectories.
Unfortunately, for modeling purposes, we rarely have data on individuals and households; however, social vulnerability is not uniformly or randomly distributed within our communities. This observation brings us back to the social geography of our neighborhoods discussed above. Researchers have shown that structure of American communities are such that we can map community neighborhoods based on their variations in dimensions of social vulnerability and that these spatially defined areas display significant variations with respect to disaster impacts and recovery.
Mapping Social Vulnerability
The NIST-COE social science team is developing social vulnerability data, maps and mapping tools for the entire United States that can be utilized in community vulnerability assessments, for preplanning of field studies, and most importantly, for the social impact and recovery modeling algorithms being development. The development of these maps and mapping tools requires: i) the compiling American Community Survey (ACS) data, ii) the selection and refinement of social vulnerability indicators, iii) the development of scales and indices reflecting particular dimensions of social vulnerability, and iv) the development of mapping and data tools to reduce uncertainties.
The team has focused on the use of American Community Survey (ACS) data from the U.S. Census at the most refined areal unit possible. More specifically we are utilizing ACS 5-year estimates that are generally available at relatively refined areal units -- block-groups. These spatial units have proven to be of sufficient resolution to capture more homogeneous neighborhoods, particularly in urban areas. We are currently working with multiple indicators reflecting population characteristics in terms of individual and household demographic characteristics (i.e., single parent households, children under 5, elder households), transportation dependence and access, housing characteristics such as tenure, racial/ethnic characteristics, educational attainment, English language proficiency, poverty, economic status and unemployment.
To enhance the utility of these data, these first order indicators, are been combined into second order indices capturing populations more likely to exhibit particular needs or vulnerabilities. These second order indices capture potential childcare/schooling needs, elder care needs, transportation needs, temporary housing and housing recovery needs, and areas with low civic capacity. These in turn can be combined to identify hotspots - or areas with higher levels of combined social vulnerability.
The following series of maps showing examples of the social vulnerability mapping data for Cameron County, Texas, on the southern tip of Texas along the United States and Mexico, with its major municipalities of Brownsville, Harlingen, Port Isabel, and South Padre Island (see Figure 2).
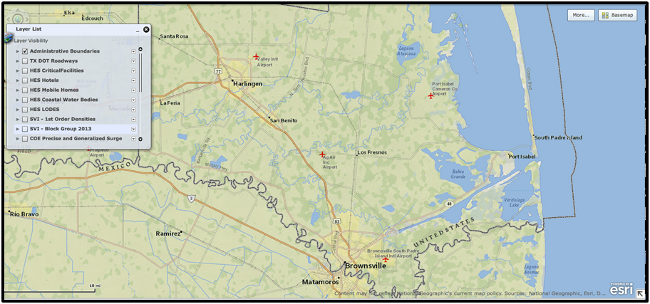
Figure 2. Cameron County, Texas.
Figure 3 shows the standard social vulnerability map, using ACS block-group data and block-group boundaries. In this particular map block-group data for single parent households with children are displayed where the darker the green, the higher the concentrations of these types of households. As can be see, these data are quite refined for the urban areas in and around Brownsville and Harlingen. However, in more rural areas the block-group boundaries are rather large which can make it to precisely locate population concentrations with these attributes.
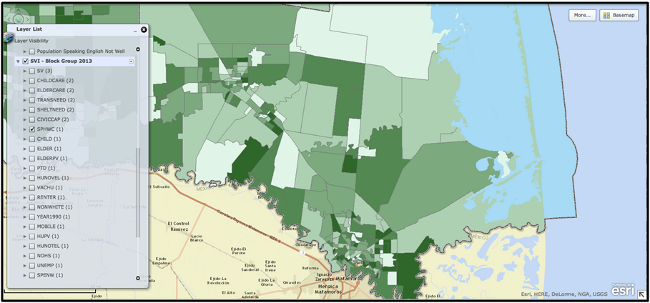
Figure 3. Areas of high concentrations of Single Parent Households with Children
Figure 4 displays a heat density map showing concentrations in and between block groups of likely areas with higher concentrations of single parent households with children. The heat density data are display such that the darker the blue, the higher the concentrations of these types of households. These types of displays are particularly useful in the more rural block-groups where it can be difficult to identify area with actual population concentrations. The social science team is researching approaches for refining and reducing spatial uncertainties based on a variety of approaches (kernel density functions, empirical Bayes estimation, etc.) and higher resolution data (LandScan, parcel, block data, etc.).
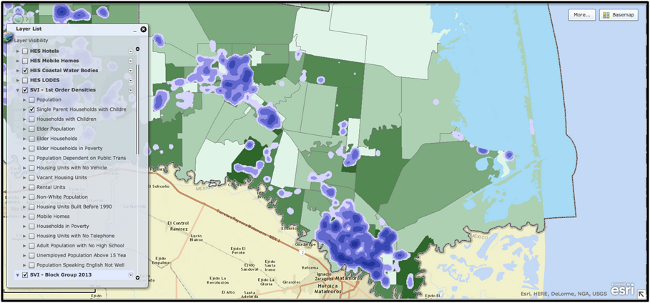
Figure 4. Heat density map highlights concentrations of Single Parent Households with Children
The final map (Figure 5), simply displays an example of utilizing a heat density map in conjunction with new Hurricane surge data produced by the Unites States Corp of Engineers (USCOE), employing traditional Sea, Lake, and Overland Surges from Hurricanes (SLOSH) output generated by the National Oceanic and Atmospheric Administration (NOAA). Developing approaches to capture hazard exposure, physical vulnerability, and social vulnerability for locations throughout a community, county, or region will be one of the goals of the NIST-COE social science research team.
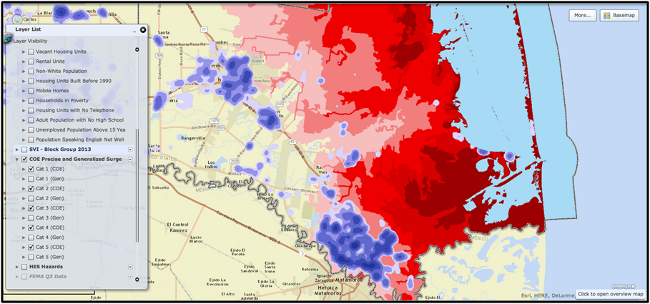
Figure 5. Heat density map highlights concentrations of Single Parent Households with Children
Conclusion
By characterizing and mapping potentially vulnerable individuals and groups, we are able identify and locate "social vulnerability hotspots" in our community. Decades of research has shown that these are the areas that will suffer disproportionately high loss of life and property, and will have the hardest time recovering after disaster. Through NIST-CoE, our team will work to advance vulnerability science in order to ultimately help make our communities safer.
Economic Systems
The economic and social costs of natural disasters are both staggering and increasing. In the wake of disasters communities often experience significant business disruptions, resulting in substantial job losses and fiscal hardships for local governments. Engineers have made great progress in improving structures and infrastructure to help communities better withstand damages from a variety of hazard events. Yet these developments are often costly, and decision makers must carefully weigh the benefits of their adoption.
Over time economists have developed a variety of tools to facilitate such analysis. In this effort we will build a family of models that are seamlessly integrated with engineering hazard models to fully assess the economic, demographic and fiscal impacts of disasters and subsequent recovery paths under different damage scenarios. In addition to scholarly advances in the economics of resilience, another overarching purpose is to provide a tool to federal, state and local decision-makers that allows them to: 1) determine appropriate building standards, and 2) develop strategic plans for effectively managing post-disaster recovery.
The intuition of our model is straightforward. On the front end, teams of engineers estimate how various probabilistic disasters would affect structures and infrastructure-both individually and as a system-under different building codes, each with their own set of associated costs, across a variety of cities and regions. For brevity, we will refer to the associated damages in each of these scenarios as changes to regional "capital stock." The next step is to examine the short- and long-run economic and social impacts of these changes and map the resiliency path. To do so, the social scientist team uses engineering information to seed a dynamic, spatially anchored economic, demographic and fiscal impact model, with the purpose of translating capital stock damage into estimates of job and income loss, out-migration (temporary and permanent) and government tax revenue impacts. Recognizing that some populations are particularly vulnerable, special attention is paid to distributional impacts and resulting social changes. With these pieces of information, the simulations allow us to understand myriad expected costs and benefits of a multitude of building code policies under a variety of disasters with heterogeneous spatial impacts.
The centerpiece of this research task is a flexible and generalizable model that can be tailored to any regional economy-a model we refer to as a spatial, dynamic computable general equilibrium (SDCGE) model. Here we model a variety of goods and service producing sectors, which sell products to households and purchase labor and other inputs in their own production processes. Households use income from wages and salaries to purchase goods and services, and they pay taxes to governments that provide public goods and services, which are demanded by both businesses and households.
Although the basic modeling approach is well-established, our research program addresses five important dimensions of the problem that have received little scholarly attention to date. First, we make a concerted effort to explicitly recognize the spatial dimension of the problem. In particular, because the physical effects of natural disasters can vary significantly even within small geographies it is essential to adequately model the spatial allocation and interaction of economic agents and resources. For example, an earthquake's impacts can be quite different depending on whether it hits a rich or poor residential neighborhood or an industrial area.
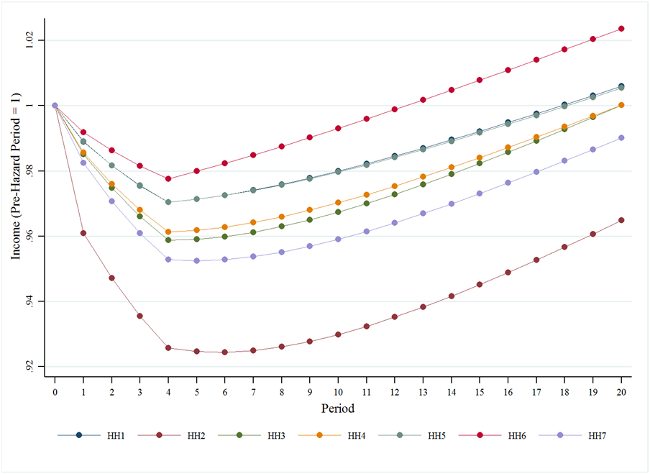
Figure 1. Recovery Path for the Distribution of Household Income
The second challenge considers the dynamics along the recovery path. Previous research shows that response timeliness has an important effect on long-term resiliency. Although some previous economic models are dynamic, they typically describe time in terms of "periods," with no real temporal unit of measurement. We are trying to better address the time step problem in resiliency modeling.
An example of the recovery path is presented in Figure 1 where household income for seven different income groups (HH1 is the lowest group and HH7 is the highest group) are presented. An earthquake impacts Centerville and there is a loss in economic activity and reductions in household income occurs over the first four periods. In period 5, resources are allocated to Centerville to implement reconstruction and Figure 1 displays how household income recovers over a 20 year period. Of note, HH6 recovers at the fastest rate while HH2 recovers at the slowest rate. These results depend upon the spatial distribution of commercial sectors and residences in Centerville.
The third challenge is the means by which the engineering models are seamlessly integrated into economic models. As noted above, structural and infrastructural damage estimates provided by the engineering teams are used to seed our economic model. Yet these models have not historically communicated well. For example, engineering models can provide estimates of structural loss or functionality, but economic models built on traditional production functions (i.e., mathematically "nice") tend to treat these capital stock changes as continuous variables, an approach that may not be appropriate in the case of hazard damage. For example, buildings may be usable, not usable, or partially compromised, with each outcome having important (and lumpy) implications for economic output that is not easily captured in traditional production functions. More fundamental than the extent of the capital stock changes, the research team is evaluating specific model integration strategies, of which economic theory suggests several. For example, loss in utility systems functionality can enter in myriad ways, including 1) directly into the production function as a unique input, 2) as an intermediate input, or 3) as an influence on the overall productivity. In this research effort we will assess each of these integration strategies.
Our fourth research task involves behavioral responses. Typically, economic impact models applied to hazard events tend to assume that the behavior of economic agents does not change because of disaster. However, recent developments in economics demonstrate substantial learning occurs in the wake of structural shocks. For example, businesses may fundamentally change their practices as part of the recovery process. We will evaluate methods to incorporate such behavioral changes as the project unfolds.
Finally, an important challenge in operationalizing our modeling toolkit is to allow policy makers to assess outcomes under a variety of probabilistic events that are spatially differentiated. To do so we will work with the industrial engineering team to use the information from the repeated simulations in developing a "policy frontier" that provides decision makers with a menu of choices and their consequences with respect to various dimensions of community resiliency.
Transportation Systems
CoE Team: Jamie Padgett, Suren Chen,Scott Douglass, Bret Webb, Dan Cox, Andre Barbosa, Francisco Aguiniga, Amy Cerato, Charles Nicholson, Naiyu Wang, Giannis Gidaris, Weili Zhang, Sushreyo Misra, Yangyang Wu, Hou Guangyang.
Transportation networks are comprised of a variety of individual constituent components such as highway bridges, roadways, railway bridges, railroads and tunnels. As spatially distributed systems, these networks are of paramount importance for the proper and smooth functioning of societies and economies. Natural hazards such as earthquakes, hurricanes, floods, and tsunamis can cause severe disruptions to these systems impairing their functionality. These compromising effects can severely impact the emergency response and ultimately the socio-economic recovery of extended regions. Establishment of comprehensive risk and resilience assessment frameworks for transportation systems, subjected to various hazards occurring independently of each other or in a concurrent/cascading manner, can facilitate pre- and post-hazard event mitigation and emergency response strategies. Development of such frameworks requires: (i) probabilistic quantification of possible damage levels that constituent components suffer when exposed to a range of hazards through fragility models, (ii) mapping the vulnerability of the components to appropriate recovery patterns to quantify restoration times and ultimately resilience using restoration models, and (iii) combining vulnerability and recovery information to support performance assessment of the transportation system in terms of network level metrics of risk and resilience.
In this process described above, several analysis tools are necessary. In particular, fragility and restoration models are required for the first and second stage, respectively. Finally the third stage necessitates appropriate network risk assessment methodologies and performance metrics that are able to inform interdependencies, socio-economic impacts and community resilience. Therefore, this task aims to provide methods and models that support and enable resilience assessment of transportation systems within the IN-CORE computational environment. In particular, the task objectives are to: (i) develop/identify fragility and restoration models for transportation network components under a range of hazards, (ii) provide a methodology for network level performance modeling, (iii) develop and implement methods for transportation network risk quantification and evaluation of network performance metrics that facilitate community resilience assessment, and (iv) support IN-CORE developers in implementing relevant models.
Research efforts are aimed at achieving the task's objectives include a state-of-the-art review of fragility and restoration models for all the constituent components of a transportation network subjected to different natural hazards and the development of a resilience analysis framework for roadway networks. The hazards of interest in the fragility and restoration modeling survey are (i) earthquake, (ii) riverine flood, (iii) tornado, (iv) wind, (v) hurricane induced surge and waves, (vi) wildfire, (vii) tsunami, and (viii) landslide. The review emphasizes models that are viable for analysis of regional portfolios or transportation networks as opposed to individual structures. The roadway network resilience analysis framework focuses on three primary features. The first involves modeling of traffic flow in transportation systems. The second feature focuses on definition and identification of a set of performance metrics to support evaluation of resilience for transportation networks in multiple dimensions. These metrics can be used individually and collectively to facilitate performance and resilience quantification of transportation networks as well as to support mitigation decisions and recovery strategies. Finally, the third feature corresponds to establishment of a methodology to interface transportation networks with social-economic systems such that the impact of natural hazards to a community is expressed in terms of social consequences and economic losses.
Figure 1 illustrates characteristic fragility models for highway bridges subjected to seismic and hurricane hazards. In particular, part (a) presents a parameterized seismic fragility model as a function of span length and peak earthquake ground acceleration (PGA). Part (b) presents a parameterized hurricane-induced coastal flood fragility model as a function of surge and wave height corresponding to the hurricane IMs.
Figure 2 presents a schematic for the road network of the Centerville virtual community testbed, which is being used to test the linkages between physical, economic and social resilience assessment models. Different colors of the various roadways of the network indicate different levels of traffic flow prior to the occurrence of a natural disaster.
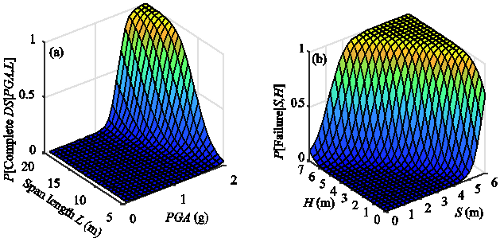
Figure 1. Parameterized (a) seismic bridge fragility as a function of span length and PGA, and (b) hurricane bridge fragility as a function of surge and wave height.
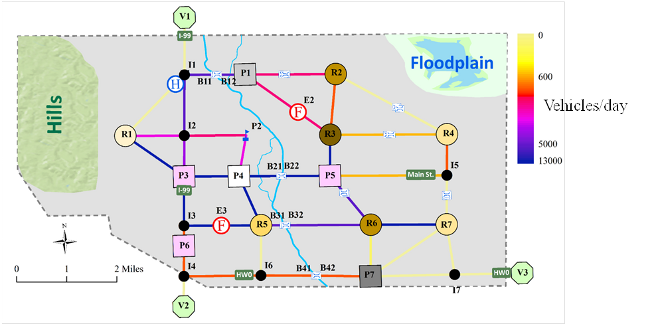
Figure 2. Road network of the virtual community of Centerville. Different colors of the roads indicate traffic flow in vehicles per day according to the color map.
Task 1.2.3. Water and Wastewater Network
Water and wastewater systems are regarded as "lifeline" infrastructure. They play a key role in our communities to support every day activities. Disruptions to water and wastewater systems can cause cascading effects influencing the economy of the entire region and the general well-being of communities. Past disasters show that water and wastewater systems are essential in the recovery from hazard events, when the water availability is crucial for minimizing the societal impact of such events and for recovering processes.
Water and wastewater networks support residential, commercial, industrial and other users by providing five key functions: supply (ground and surface), transmission, treatment, pumping, and storage of water. Such networks are large, distributed interdependent systems of multiple components that typically extend across wide areas. Network components include linear components like pipelines, tunnels, canals and flumes, and punctual or nodal components like tanks and reservoirs, and treatment plants, pumping stations and wells. Fig. 1.A shows a schematic representation of an example water network.
Because water and wastewater networks are distributed over a large area and because of the variety of components constituting the network, these networks are vulnerable to a number of natural hazards. Furthermore, many of the pipe networks currently used are over a century old, making them more vulnerable to hazards.
Hazard events can cause direct physical damage to several components in the water and wastewater networks. In general, different components in the networks are vulnerable to different hazards. For example, earthquakes may cause damage to pipes that might result in breakage or leakage and pressure losses, and wind may damage above ground facilities like tanks, affecting the network functionality. In this work, we estimate the probability of damage of each component in the water and wastewater network considering multiple hazards.
In addition, the water and wastewater networks also depend on the service provided by other networks as well as on the performance of the housing buildings. For example, the functionality of a water pump in the aftermath of an extreme event depends not only on its possible direct damage but also on the availability of the power provided by the power network (or local generators) and on the damage state of the building housing the pump. Fig. 1.B conceptualizes the analysis of the direct damage of each component in the network and its dependency on the functionality of other networks.
The direct damage on the network components and the availability of service from the supporting networks define the functionality of the water and wastewater networks, including for example the availability of potable water throughout the water network and the water pressure. In this work, we assess the functionality of the network; for example for the water network we determine the water quality and pressure at any point in the network. Fig. 1.C illustrates the water flow analysis that is conducted using the results from the damage and functionality analysis.
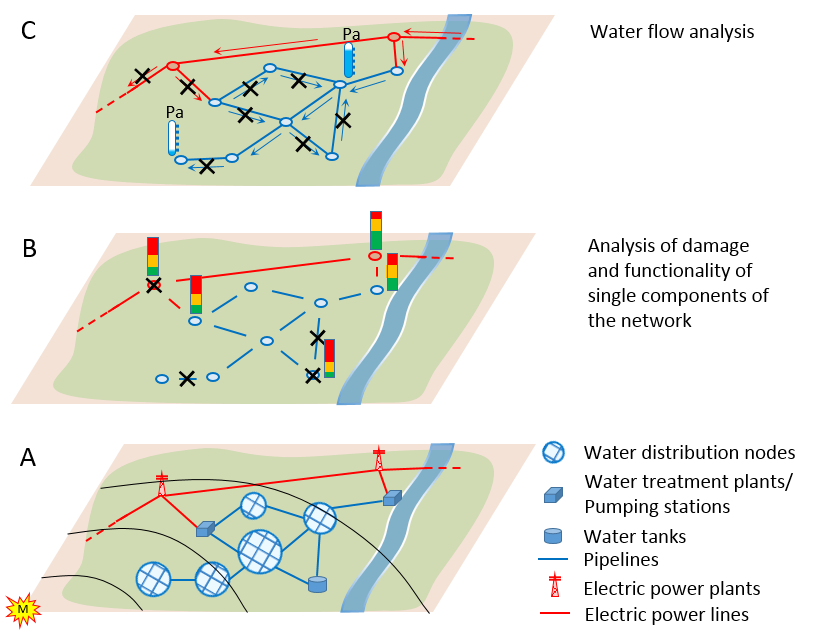
Fig. 1. A: Representation of a water network and its interaction with a supporting network (e.g., the electric power network); B: Analysis of the damage of single components of the network; C: Water flow assessment in the post-event scenario.
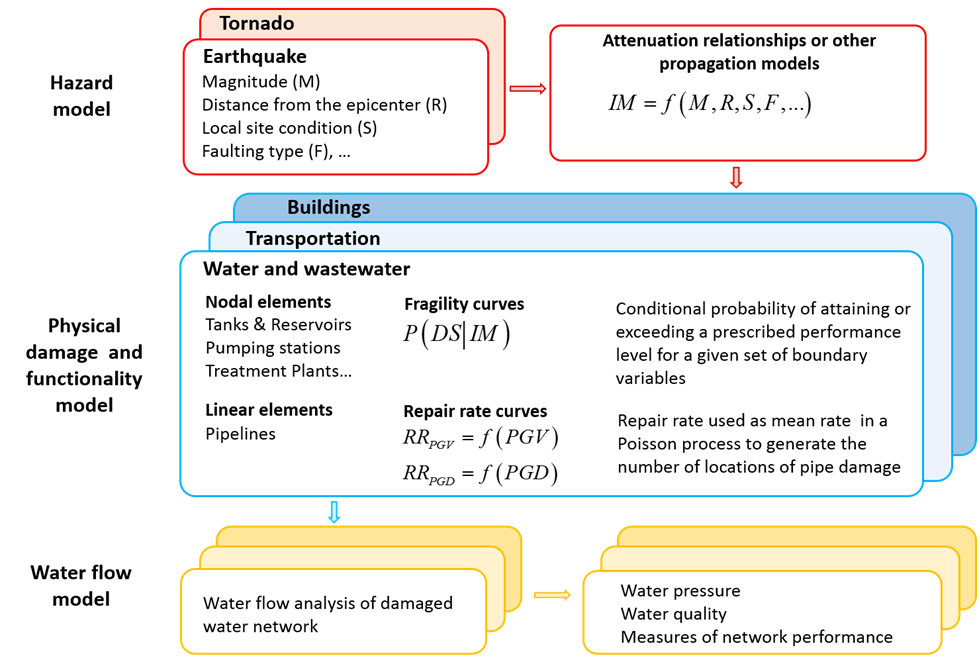
Fig.2. Conceptual analysis flow
Fig. 2 summarizes the analysis with reference to a water network subject to an earthquake. The procedure is general and able to model the wastewater network response as well other networks and hazards. The first step models the hazard. In the case of an earthquake, ground motion prediction equations are used to provide the values of desired intensity measures at specific locations as a function of the specified earthquake characteristics (magnitude, epicenter location, local soil conditions, etc.) The second step assesses the physical damage and functionality of the network's components. For the nodal components, fragility curves are used to predict the probability of being in different damage states, while the repair rates are used to assess the recovery and functional state of the linear components. In addition, information on the physical damage of supporting networks is integrated with the assessment of direct physical damage to fully define the functionality of each network component. As a third step, a water flow analysis is carried out to evaluate the functionality of the networks. For example, the pressure and quality of the water is computed at the desired demand nodes in the water network.